The graph below shows the percentage of people by age group visiting the cinema at least once per month in one particular country between 1978 and 2008. Summarize the information by selecting and reporting the main features and make comparisons where relevant.

The graph below shows the percentage of people by age group visiting the cinema at least once per month in one particular country between 1978 and 2008.

Summarize the information by selecting and reporting the main features and make comparisons where relevant.
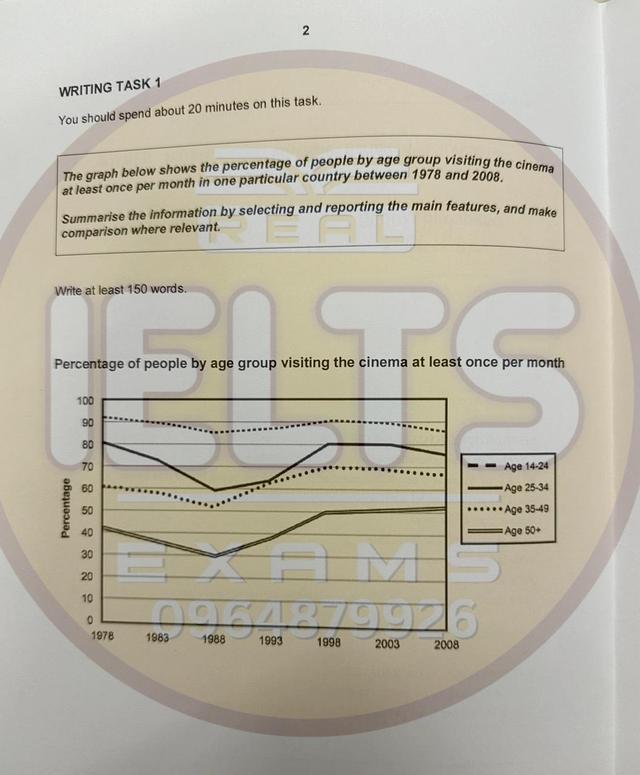
The line graph above meticulously delineates the number of individuals
inclines
Wrong verb form
inclined
show examples
to visit cinemas by the age range and over 30 years. Plus, all the lines reveal the statistics
according to
percentage. In an
overall
view, the upper echelon of the graph reveals teenagers and youths have more enthusiasm for watching movies on the cinema's screen,
while
middle-aged ones and seniors don't show a high tendency. The tendency of crowds under 34 years old is persistently increasing. It is cited that teens with the highest engagement with 80% act a salient role.
However
, adults have an unwavering upward movement of 60%. The trajectory for people over 35 and 50+ indicates a discernible lack of attendance in movie theatres.
Although
both trends were parallel and close, an overarching confluence occurred and the 35-49 by approximately 40%, 50+ with around 20% converged to 50% by 2008.
Submitted by TUTOO on

Unauthorized use and/or duplication of this material without express and written permission from this site’s author and/or owner is strictly prohibited. Excerpts and links may be used, provided that full and clear credit is given to Writing9 with appropriate and specific direction to the original content.

Common mistake: Your writing should be 150-250 words.
Basic structure: Change the third paragraph.
Vocabulary: The word "graph" was used 2 times.
Vocabulary: Use several vocabularies to present the data in the third paragraph.
What to do next:
Look at other essays: