
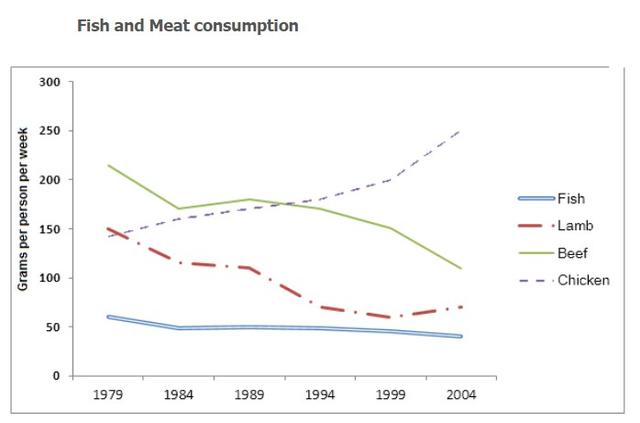
The diagram illustrates how much fish and some different kinds of meat were consumed in a country in Europe between 1979 and 2004.
There was a decrease in beef, lamb, and fish consumption,
with
witnessing the most dramatic drop in the beef sector. Change preposition
apply
While
there was an increase in chicken Linking Words
as well as
the highest number in the latter period.
The amount of consumption of chicken started at under 150 Linking Words
grams
, after which experienced a thriving growth to exactly 250 Use synonyms
grams
in 2004. Use synonyms
Conversely
, the figure for beef declined significantly from over 200 Linking Words
grams
to around 100 Use synonyms
grams
in the final year.
150 Use synonyms
grams
of lamb consumption was used by the average person per week in 1979, Use synonyms
then
Linking Words
observing
a gradual decline to about 50 Wrong verb form
observed
grams
. Meanwhile, the figure for fish was hovering around 50 Use synonyms
grams
.Use synonyms