
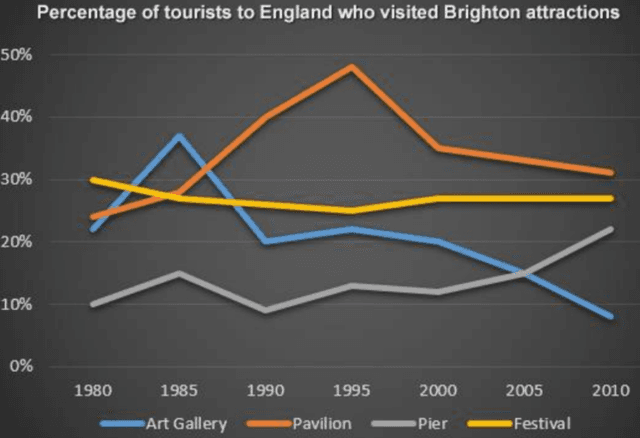
The line graph illustrates the trends of 4 Brighton attractions that tourists travelled from 1980 to 2010. As a general
trend
,Use synonyms
it is clear that
the Festival had the highest proportions in 1980,Linking Words
while
the Linking Words
Pavilion
had the most in 2010.
Looking more closely at the data, in 1980,the Use synonyms
Pavilion
had 25% Use synonyms
travellers
,but Change preposition
of travellers
following
Linking Words
this
,there was a high rocket to a peak of almost 50% in 1995.Linking Words
However
,in 2000,the tourists of Linking Words
Pavilion
declined sharply to 35% in 2000.Use synonyms
Finally
,there was Linking Words
then
a slight decrease to 30% in 2010.
Showing a completely different Linking Words
trend
,the number of visitors Use synonyms
from
the Art Gallery was Change preposition
to
22
Correct your spelling
22 in
%in
Use synonyms
the
1980,before a dramatic fluctuation to 20 % between 1980 and 1995. Change the article
apply
After
Linking Words
this
, there was a minimal climb to 22% in 1995,and from Linking Words
then
on,there was a gradual drop to 8% in 2010.Linking Words
On the other hand
,the tourism of the Festival was a steady Linking Words
trend
in Use synonyms
this
time period,in 1980,the percentage was 30% Linking Words
while
it had 27Linking Words
%in
2010.
Showing a similar Use synonyms
trend
,the pier had 10Use synonyms
%in
1980,there was Use synonyms
then
a gradual fluctuation between 1980 and 2000. Linking Words
However
,the Linking Words
trend
rose sharply to 22Use synonyms
%in
2010.
In sum, Use synonyms
although
the festival was the most popular attraction in 1980,the Linking Words
Pavilion
was higher than in 2010.Use synonyms