
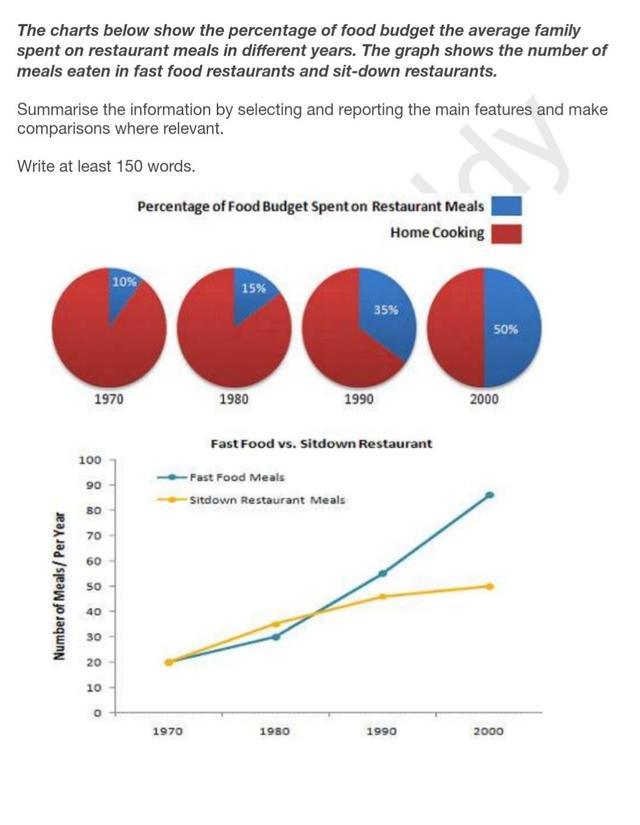
The four pie charts illustrate the proportion of
food
Use synonyms
budget
spent on Use synonyms
restaurant
Use synonyms
meals
and home cooking for every family from 1970 to 2000 and the line graph displays different numbers of Use synonyms
meals
taken in fast Use synonyms
food
and Use synonyms
Use synonyms
sitdown
restaurants from 1970 to 2000 respectively.
As the charts show, the rate of Correct your spelling
sit-down
restaurant
Use synonyms
meals
' Use synonyms
budget
occupied 10% and the rate of home cooking's Use synonyms
budget
took up 90% in 1970, followed by the proportion of money spent on canteen Use synonyms
meals
was 15% in 1980. After the proportion of their Use synonyms
food
Use synonyms
budget
spent on Use synonyms
meals
Use synonyms
outdoor
for every family occupied 35%, it hit Replace the word
outdoors
a
equal point, which means that the rate of Change the article
an
restaurant
Use synonyms
meals
' Use synonyms
budget
and home cooking's Use synonyms
budget
were the same in 2000.
When it comes to the linear graph, the Use synonyms
number
of Use synonyms
meals
taken in fast Use synonyms
food
canteen and the Use synonyms
number
of Use synonyms
sitdown
Use synonyms
restaurant
Use synonyms
meals
started at the same point, which is 20 in 1970. Use synonyms
Then
the Linking Words
amount
of Use synonyms
Use synonyms
sitdown
Correct your spelling
sit-down
restaurant
Use synonyms
meals
surpassed the Use synonyms
amount
of fast Use synonyms
food
Use synonyms
meals
to about 33% in 1980. Use synonyms
However
, the Linking Words
amount
of take-away Use synonyms
food
Use synonyms
meals
grew faster than the Use synonyms
amount
of Use synonyms
Use synonyms
sitdown
Correct your spelling
sit-down
restaurant
Use synonyms
meals
to around 53% in 1990, before the Use synonyms
number
of take-away Use synonyms
food
Use synonyms
meals
ascended to around 90% in 2000.
To summarise, the percentage of Use synonyms
Use synonyms
food
Correct article usage
the food
budget
spent on canteen Use synonyms
meals
and the Use synonyms
number
of fast Use synonyms
food
and Use synonyms
sitdown
Use synonyms
restaurant
Use synonyms
meals
all revealed Use synonyms
a
increasing trajectory.Change the article
an