
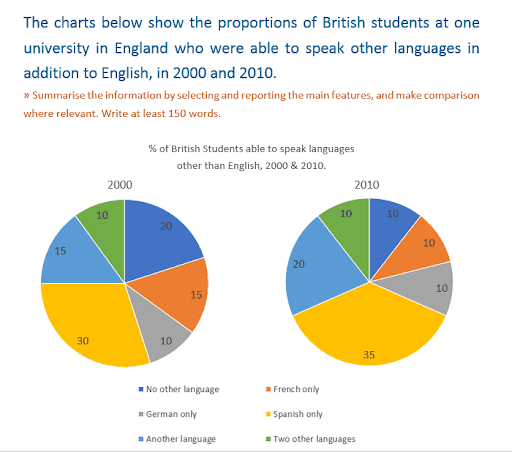
The Pie Charts represent the comparison of British
students
' ability to use foreign Use synonyms
languages
but Use synonyms
English
10 years apart. Calibration of data is done in per cent.
Use synonyms
Overall
, the proportion of Linking Words
students
who mastered language aside from Use synonyms
English
increased well. In 2000, Use synonyms
students
that only speak Use synonyms
English
were five amount of the full Use synonyms
students
, Use synonyms
in contrast
in 2010 Linking Words
this
percentage decreased by half the presentation to 10%. Linking Words
Moreover
, Linking Words
students
who speak two other Use synonyms
languages
Use synonyms
also
had a 5% increasing percentage in 2010 from 10 to 15%.
Linking Words
To begin
with, Linking Words
students
included in Use synonyms
this
report who are able to speak one language other than Linking Words
English
dominated the other option given. The rank of Use synonyms
languages
that are most spoken is mostly the same throughout the years. Spanish is the first rank of most spoken Use synonyms
languages
Use synonyms
while
other Linking Words
languages
placed second. Use synonyms
Although
in 2000, french was used widely by Linking Words
students
, its percentage lessened ten years later. Currently, Both German and French are placed third in 2010.Use synonyms