The chart gives information about the percentage of overweight men and women in Australia from 1980 to 2010.

✍️ Want to check your own essay?Try for free →
The chart gives information about the percentage of overweight men and women in Australia from 1980 to 2010.
IELTS Writing Task Chart for The chart gives information about the percentage of overweight men and women in Australia from 1980 to 2010.
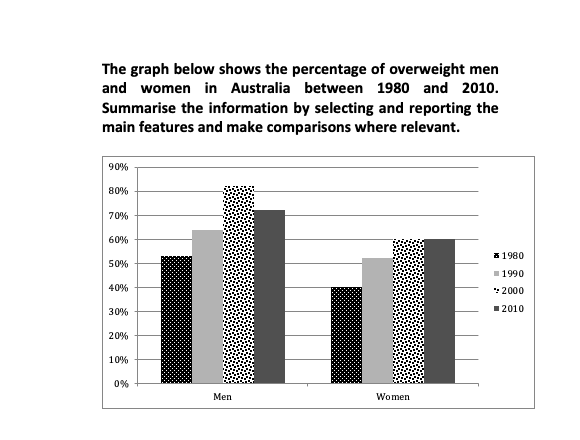
The bar chat illuustrates proportion of males and females over A five-year period from 1980 to 2010. From the graph, it is clear
the
Correct word choice
that the
show examples
number of overweight
women’s
Verb problem
women is
show examples
lower than
men
Correct pronoun usage
that of men
show examples
data
Check wording
apply
show examples
.
While
Linking Words
the
women
Check wording
number of women
show examples
fighers
Correct your spelling
fighters
increased
gradualy
Correct your spelling
gradually
over the period. In terms of
japan
Fix capitalization
Japan
show examples
data,
overweight tood at
Correct word order
the rate of overweight increased slowly from 40% in
show examples
1980 climb slow from 40% to 65% at 2000
there
Punctuation problem
. There
show examples
was a slow increase by 25%, decline at
2010
Punctuation problem
2010,
show examples
amout 5% from 65% to 60%. Regarding
female’s
Check wording
female
show examples
figures,
overweight a quick rise
Correct word order
the rate of overweight rose quickly
show examples
from approximately 30% in 1980 to 50% 2010. There was a considerable go up over the period.

Unauthorized use and/or duplication of this material without express and written permission from this site's author and/or owner is strictly prohibited. Excerpts and links may be used, provided that full and clear credit is given to Writing9 with appropriate and specific direction to the original content.

Sentences: Add more complex sentences.
Linking words: Add more linking words.
Introduction: The introduction is missing.
Introduction: Change the first sentence in the introduction.
Introduction: The chart intro is missing.
Common mistake: Your writing should be 150-250 words.
Introduction: The chart intro is missing.
Vocabulary: The word "data" was used 2 times.
Vocabulary: The word "increased" was used 2 times.
Vocabulary: The word "slow" was used 2 times.
What to do next:
Look at other essays: