
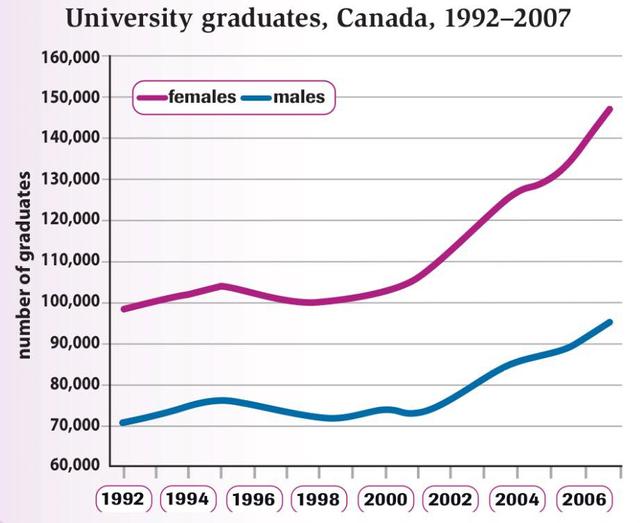
From the visuals below, we can see how many university students have graduated from 1992 to 2007 in Canada. The chart portrayed two streams of data based on sexes, which are females with pink lines and males with blue lines.
In general, both divisions showed a positive trend with a little bit of oscillation between 1995 and 6 years afterwards. The number of degree holders is consistently dominated by women at 150.00,
while
men remained six-tenth of them until the end of the period.
Since the start of the year, women are already 30.000 higher than men. There are no extreme increases, and the trend is quite steady. The figure begins to soar up from 1998, with a total addition of 150%. It Linking Words
also
stated that Linking Words
this
group never experienced a dip ever since.
Turning to the next division, the condition is more fluctuative, especially until 2001. Linking Words
In contrast
to the spur of women 3 years before that, the amount of men still faces several ups and downs. The positive change started to appear from 2001 to 2006 with an Linking Words
overall
31% increase, accounting for one-third lower than the other sexes.Linking Words