
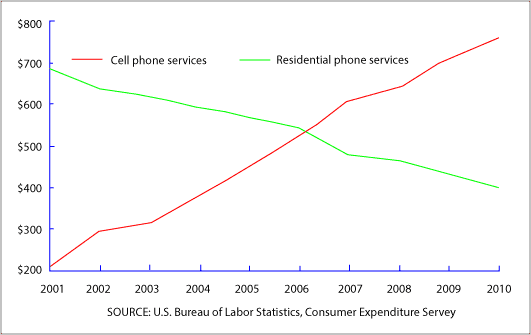
The graph above illustrates the yearly amount for spending on average of two different types of
phone
services from 2001 to 2010.
Generally speaking, it is apparent that the expenditure for Use synonyms
cell
Use synonyms
phone
Use synonyms
service
saw a constant decrease throughout the entire period, Use synonyms
while
the figure for residential Linking Words
phone
Use synonyms
service
rose over the same time frame.
Focusing on the period 2001-2006, in 2001, most of the consumers chose to Use synonyms
cell
by residential Use synonyms
phone
, with the amount of services consumption standing at just below $700 in 2001, the peak of the whole survey, Use synonyms
while
the data for Linking Words
cell
Use synonyms
phone
Use synonyms
service
was at only around $200 in the same year. Use synonyms
Subsequently
, the annual expenditures of these two categories of Linking Words
phone
services were equal in 2006, at roughly $550.
In the following 4-year period, there was a steady incline in the figure for Use synonyms
cell
Use synonyms
phone
Use synonyms
service
, reaching approximately $750 in 2010, Use synonyms
although
the average data for residential phones dropped continuously until the end of the whole investigation, which reached close to $400 in the Linking Words
last
year.Linking Words