
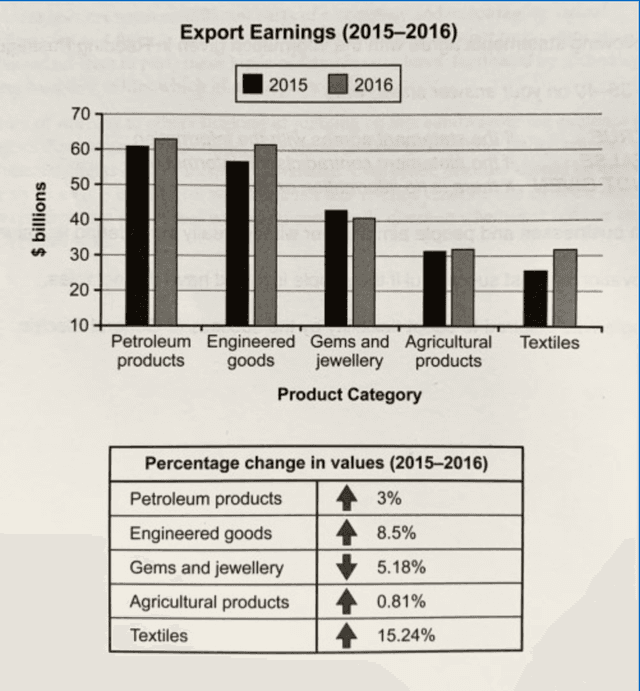
The bar chart illustrates how much money was earned from exporting in five different categories in a country between 2015 and 2016. The table compares the proportion of changes in each group during the same period.
Overall
, petroleum products composed the largest Linking Words
amount
of Use synonyms
exports
in the country during these two years, Use synonyms
whereas
the export of textiles was the lowest Linking Words
amount
during the same time. Use synonyms
Moreover
, the table shows that the value of Linking Words
exports
in all categories increased except in the gems and jewellery sector.
Use synonyms
According to
the graph, petroleum products had the highest Linking Words
amount
of Use synonyms
exports
at 60 Use synonyms
billion
Use synonyms
dollars
and nearly 62 Use synonyms
billion
Use synonyms
dollars
in 2015 and 2016, respectively. Use synonyms
However
, textiles’ Linking Words
exports
were the smallest at 25 Use synonyms
billion
Use synonyms
dollars
and 31 Use synonyms
billion
Use synonyms
dollars
in the years 2015 and 2016, respectively. it can be implied that the Use synonyms
amount
of money from exporting agricultural products was equal over the two years at roughly 30 Use synonyms
billion
Use synonyms
dollars
.
Considering the table, from 2015 to 2016, gems and jewellery were the only sectors that saw a significant decline of 5.18% in Use synonyms
exports
. It is worth noting that the export of textiles and engineered goods experienced the highest increase at 15.24% and 8.5%, respectively.Use synonyms