
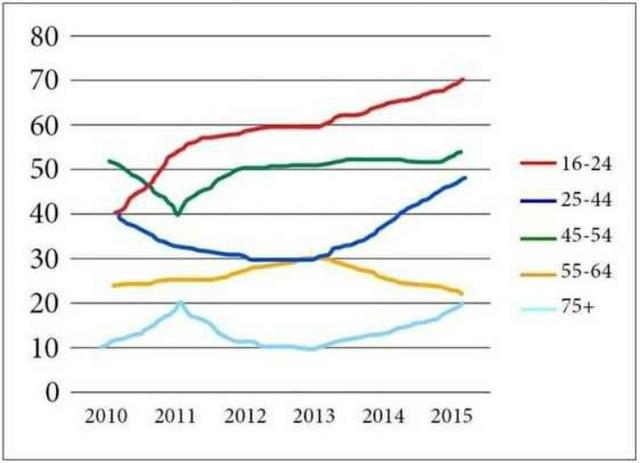
The line graph presents the number of European residents in various age categories who hit the gym at least once during 30 days of daily routines between 1990 and 2010.
Overall
, it is noticeable that all data showed upward trends Linking Words
at the end
of the period. Linking Words
In addition
, the rate of younger people undoubtedly was greater than the oldest participants who participated in Linking Words
this
evaluation.
Linking Words
To begin
with, at the top level, teenagers and adults increased to just under 10% in 1990, before they jumped gradually and Linking Words
finally
landed on the same point by approximately 29% in the next eight years. Linking Words
Moreover
, the former experienced a fluctuating trend from 1998 to 2008 and reached a peak just below 60%; Linking Words
in contrast
, the ladder just climbed steadily by 20% in 2010.
Linking Words
On the other hand
, It coincided with the rest categories, including the mature people, 35 to 44 years old, and the oldest, that consistently went into a moderate incline during the whole of the period, accounting for 40% and 21%, respectively.Linking Words