
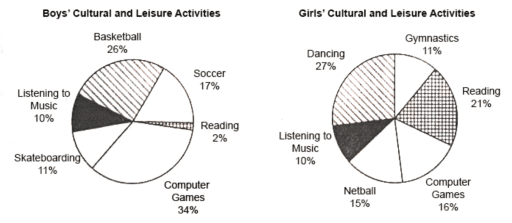
The provided pie chart shows the survey between males and females's focusing rates in the different classes. The data given in percantages and it can be split into two groups, huge and large proportions.
Overall
, it is obvious to see that most of the boys were interested in playing computer games, Linking Words
while
girls had the highest among of dancing.
First of all, there are a variety of types of activities for students, The number of playing electric games was the highest at 34%. Linking Words
Furthermore
, the second largest amount of Linking Words
the
participation was Basketball, which is less than a computer game only 8%. Correct article usage
apply
According to
soccer, skateboarding, and listening to music were in the similar range, roughly 10%-20%. Meanwhile, the figure witnessed the lowest amount of interest at 2%, which is the reading.
Linking Words
On the other hand
, turning to the girls' culture of activities. Dancing and Reading accounted for 21% to 27%. Linking Words
In addition
, females spent their leisure time quite a lot on netball and computer games around 15%-16%. Linking Words
While
the least of things that women would like to spend their free time with was gymnastics and listening to music, above more than 10%.Linking Words