
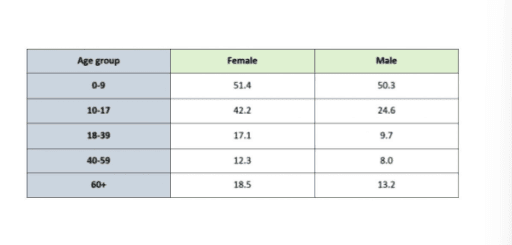
The following table illustrates the proportion of the total individuals who were cycling in a town in the year 2011.
Looking from an
overall
perspective, it is readily apparent that women did more cycling than menLinking Words
Add the comma(s)
, as well as the highest numbers to ride bicycles,
as well as
the highest numbers to ride bicycles were the female child Linking Words
group
and teenager Use synonyms
group
, Use synonyms
whereas
adults and over 60 mature categories were the next predominant trend. Linking Words
In addition
, the 40-59 age Linking Words
group
, both males and females, had the lowest percentage over the period given.
Use synonyms
According to
the figure, 0-9 aged female kids were at 51.3 per cent compared to 1 per cent higher than males. Linking Words
Likewise
, the total data of the youngsters aged between 10 and 17 both men and women were 42.2 and 24.6 respectively.
As for remaining, the Linking Words
adults'
category among women to ride bicycles was 17.1 Change noun form
adults
which
Correct pronoun usage
apply
this
number decreased in the male Linking Words
group
which was at 9.7. Eventually, the people aged between 40 and 59 were at 12.3 in females and exactly 8.0 in males.Use synonyms