
Contained in the bar
chart
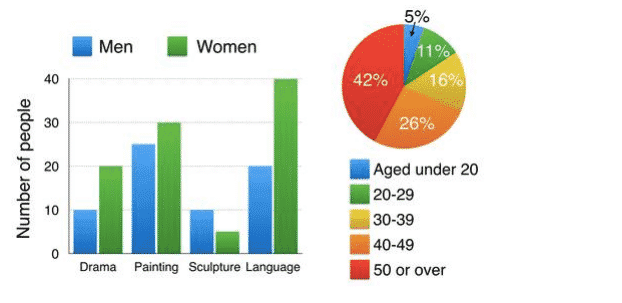
is information pertaining to the number of two genders attending evening classes in an education centre for adults. The second pie Use synonyms
chart
illustrates the ages taking part in these courses
Use synonyms
Overall
, it can be seen that more females taking these courses with the exception of Sculpture where males attended more. Linking Words
Additionally
, the 50 or over showed more participants than other groups and as the age got older, the participants got lower
Regarding the first bar Linking Words
chart
, the number of females enrolled in Drama, Painting, and Language ranged from 20 to 40 persons, Use synonyms
while
the number of Men taking Drama was 10, 25 in Painting and 20 in Language. With respect to Sculpture, exactly 10 men enrolled in Linking Words
this
course, double that of women.
Turning to the pie Linking Words
chart
, the 50 or over gained more interest in evening classes with exactly 42%. With regards to the 20-29, 30-39 and 40-49 groups, the proportion of people participating was 11%, 16% and 26%, respectively. The groups of people aged under 20 show less interest in these courses with just 5% of attendants.Use synonyms