
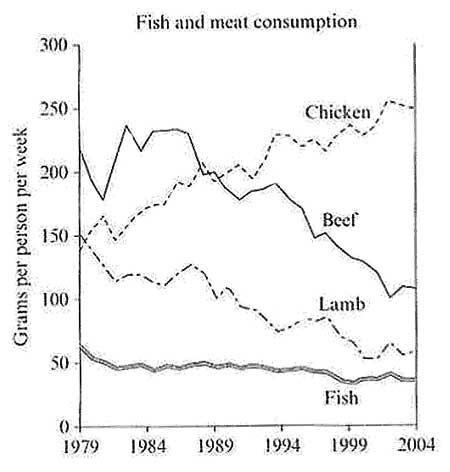
This
line graph compares the trends of consumption of lamb, fish, chicken and beef in a European country between 1979 and 2004.
Linking Words
Overall
, the number of grams per person per week for lamb and beef has gradually lowered Linking Words
while
consuming chicken has significantly risen. Linking Words
On the contrary
, the quantity of fish per individual has been stable over time.
In 1979, Beef consumerism was at a particularly high rate of approximately 220 grams/person/week but quickly dropped to obtain a quantity of 0,1 kilograms in 2004. Linking Words
Similarly
, consuming lamb has decreased over the years approaching, in the 2000s, 60 or 55 units.
Linking Words
On the other hand
, chicken has been more consumed during those years than any other type of meat. Linking Words
Furthermore
, the rooster quantities consumed started at a low of 0,150 kilograms yet increased to 0,1 kilograms in the next 25 years. Linking Words
Finally
, the consumption of fish in 7-day periods of time has not slowed nor risen, its consumption has stabilized at around 50 grams.Linking Words