
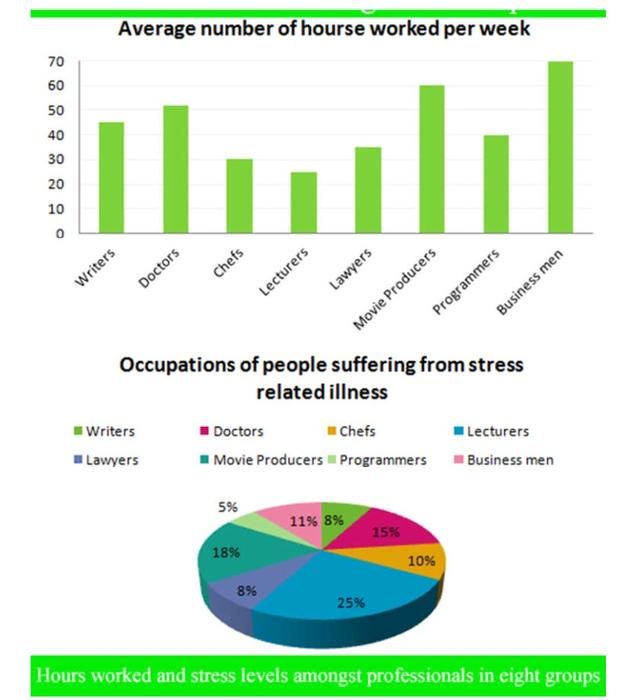
There are two graphs.
Firstly
, the bar graph depicts the information about Linking Words
mean
of worked Add an article
the mean
a mean
hours
among 8 different professions. Use synonyms
On the other hand
, the second graph corresponds to a pie chart that illustrates health issues Linking Words
due to
high Linking Words
level
of stress measured in percentages.
Fix the agreement mistake
levels
Overall
, business managers and movie producers were those who worked most Linking Words
hours
with an average of 70 and 60 per week, respectively. In comparison Use synonyms
to
lecturers Change preposition
apply
that
showed the lowest quantity of approximately 25 Correct pronoun usage
apply
hours
and chefs Use synonyms
in
30.
Change preposition
apply
Additionaly
, Correct your spelling
Additionally
according to
the pie chart lecturers were Linking Words
who
most presented illness related to stress, Correct determiner usage
those who
however
, Linking Words
this
result is totally contrary to those Linking Words
hours
that were worked by them because its rate was the lowest. The second highest percentage was Use synonyms
showd
among Correct your spelling
shown
showed
doctor
with a value Fix the agreement mistake
doctors
stimated
de in 15%. Correct your spelling
estimated
Besides
, 11% of Linking Words
bussiness
workers suffered a disease. Correct your spelling
business
Finally
, programmers and writers were the groups with Linking Words
less
rate of disorders.Correct word choice
the lowest