
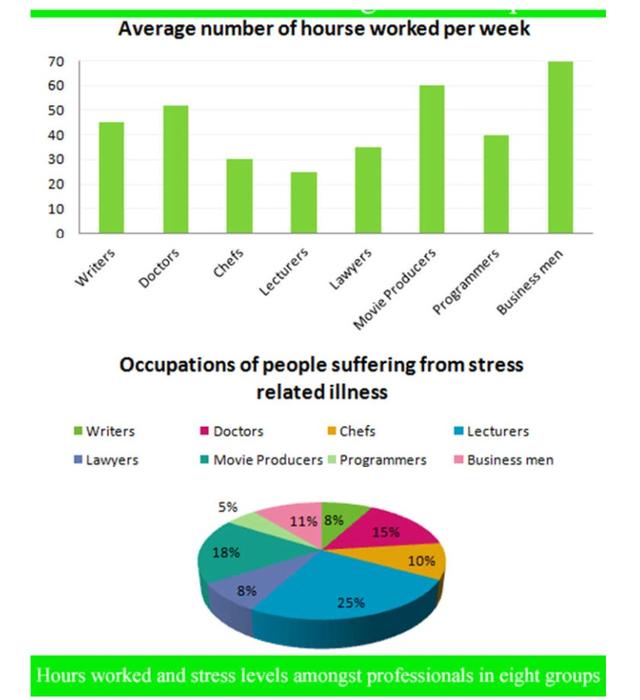
The bar
chart
below shows eight different Use synonyms
groups
and how many Use synonyms
hours
a week are working and the pie Use synonyms
chart
under, the occupation of people suffering from stress, Use synonyms
Linking Words
also
divided Add a missing verb
is also
in
eight Change the preposition
into
groups
. Use synonyms
Overall
, as it can be seen in the bar Linking Words
chart
, Use synonyms
Use synonyms
business men
and Correct your spelling
businessmen
movie
producers work more than others.
First of all, the bar Use synonyms
chart
shows eight different Use synonyms
groups
and how many Use synonyms
hours
are Use synonyms
spending
a week. Chefs, lecturers, and lawyers are working the least amount of Wrong verb form
spent
hours
, under 40 Use synonyms
hours
every week. Writers and programmers Use synonyms
are working
around 45 Wrong verb form
work
hours
Use synonyms
approximately
and exactly 40 Rephrase
apply
hours
as Use synonyms
a programmers
. Moving forward to the Correct the article-noun agreement
a programmer
programmers
movie
producers and Use synonyms
Use synonyms
business men
, the amount of Correct your spelling
businessmen
hours
Use synonyms
spending
at work goes over 50 Wrong verb form
spent
hours
each, 60 Use synonyms
hours
for a Use synonyms
movie
producer and 70 Use synonyms
hours
for a Use synonyms
Use synonyms
business man
.
Correct your spelling
businessman
Secondly
, when Linking Words
is
Verb problem
it comes
about
stress, programmers, writers and Lawyers, the percentage of stress is under 10 per cent. The most stressful group is lecturing, with 25 per cent, Change preposition
to
then
the other four Linking Words
groups
(Use synonyms
Use synonyms
business men
, doctors, chefs and Correct your spelling
businessmen
movie
producers) which are below 20 per cent.Use synonyms