
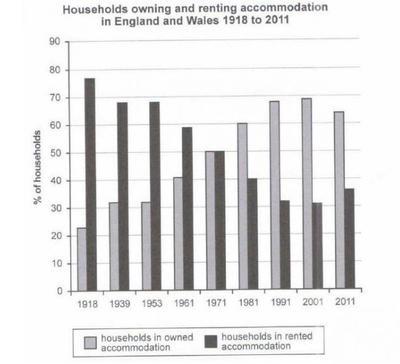
The diagram demonstrates the percentage of households who settled in owned and rented locations in England and Wales between 1918 to 2011.
Regarding the households in rented accommodation, rent was at its peak in the first
year
of record and it had a value of around 77 percent. Since Use synonyms
then
, it started to decrease significantly up to Linking Words
Use synonyms
year
2001. Correct article usage
the year
In addition
, between the years 2001 and 2011 | can see a slight increase but it is negligible compared to the amount of reduction in previous years.
In regard to the Households in Linking Words
owened
accommodation, unlike the other representation, the Owed graph was at its minimum in the Correct your spelling
owned
year
1918 but as time went by, it began to rise. Use synonyms
Additionally
, Linking Words
this
graph was able to achieve its highest score by 2001 and after that, it had a tiny deduction.
Linking Words
Overall
, despite the fact that they had the same detail at some points, they were reflecting the opposite of each other. Linking Words
Although
both graphs had lots of fluctuations, they lined up in Linking Words
Use synonyms
year
1971 and they were holding the same value at Correct article usage
the year
this
point.Linking Words