
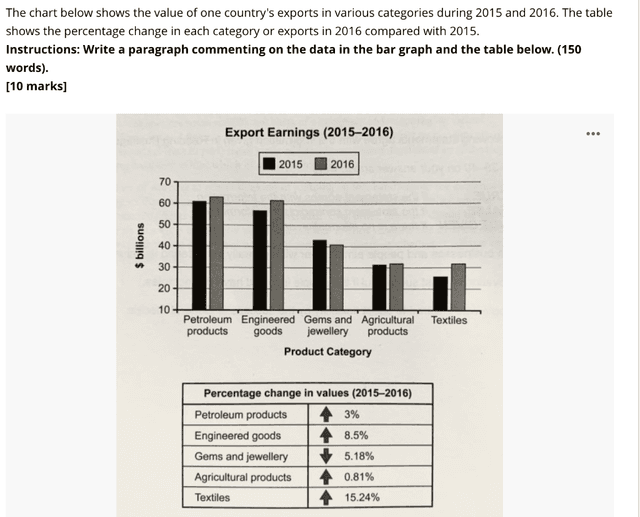
The bar chart below depicts the portion of commodities of one country's exports between 2015 and 2016.
Overall
, petroleum products are the dominating commodity each year with 61B$ in 2015 and 63B$ in 2016 because it made up the 3% rise in two years. petroleum and engineered stocks have been the most exported items in both two years as well, the least ones are the gems and jewellery, agricultural wares and textiles.
It's apparently seen that only the gems and jewellery has been decreased in export earnings in 2016 which downturned to 5.18%
The highest upturn in Linking Words
this
category is textiles which rioted to 15.24%. The agricultural things were the most consistent good which remains constant by 0.81% difference.
It's interesting to note that, the share of petroleum and engineered equipment are equal Linking Words
while
engineered properties soared by 8.5% which is 5.5% more than engineered products. Linking Words
Moreover
, the interval between them is around 40B$.Linking Words