
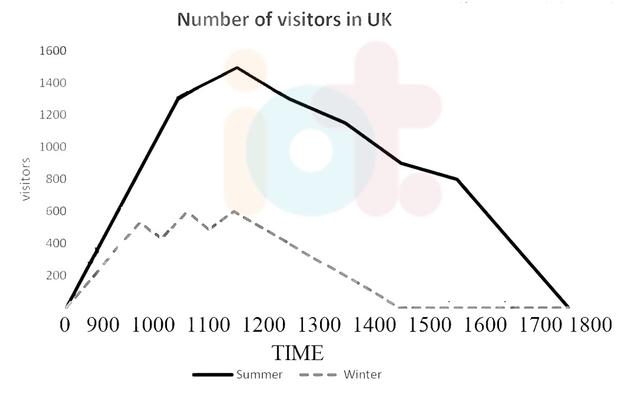
The presented line
graph
illustrates the data about the number of Use synonyms
visitors
visiting a Use synonyms
museum
in several seasons in 2003.
Use synonyms
Overall
,it is shown that the whole year Linking Words
people
visit the Use synonyms
museum
,Use synonyms
however
,during summer Linking Words
time
Use synonyms
people
visit the Use synonyms
museum
more than in wintertime.
On the one hand,in the sunny season,after starting the Use synonyms
museum
Use synonyms
people
went there and in the range of 1100-1200, Use synonyms
time
period Use synonyms
people
's attendance was dramatically high at more 1400,which was the highest in the total Use synonyms
graph
.Use synonyms
People
's participation went down to 800 before Use synonyms
time
went to 1600.After that,the Use synonyms
graph
went through a sharp fall and reached 0 audiences in closing Use synonyms
time
(1800).
Use synonyms
On the other hand
,in the winter season,after opening the Linking Words
museum
Use synonyms
visitors
went there and between 1100-1200 Use synonyms
time
individuals number reached its peak at 600,which was half of Use synonyms
summertime
Add an article
the summertime
visitors
in that given Use synonyms
time
.After that, the Use synonyms
graph
saw a significant fall and reached 0 Use synonyms
visitors
in 1400 Use synonyms
time
period.Use synonyms
Time
between 1500-1800 no Use synonyms
visitors
were there.Use synonyms