
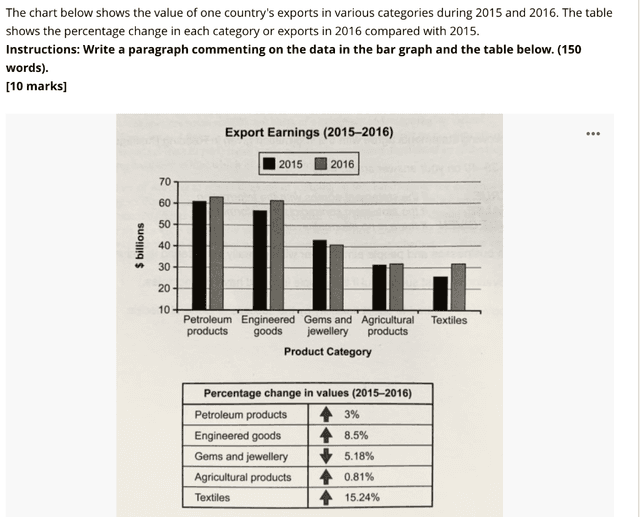
The chart illustrates the value of various categories during 2015 and 2016 in one country.
Additionally
, the table shows the change in ratio that occurred in each range of exports when the comparison was done.
Linking Words
Overall
, the major point in the textile business was an increase of 15.24% in 1 year and the minor point between 2015 and 16 was agricultural product exports which bloomed slightly by 0.81%.
Linking Words
However
, the percentage of Petroleum exportations was 61% elevated up to three per cent in 2016, and is now 64%. Linking Words
In addition
, the engineered goods moving was 55.5% and climbed by 8.5% in one period and now 64%. Linking Words
Also
, the export of Gems and Jewellery decreased by 5.18%, from a per cent scale of 45.1% to 40%.
Linking Words
Moreover
, the circulation of agricultural products in 2015 was 31% and in 2016 it was 31.8% inclination of 0.81%. Linking Words
Along with
Linking Words
this
, the export of textiles in 2015 was 24% and elevated by 15.2 per cent in the period 2016. Linking Words
Therefore
, these represent the issue of several types of products in one period.Linking Words