The graph below shows the percentage of Australian exports to four countries from 1990 to 2012. Summarize the information by selecting and reporting the main features, and make comparisons where relevant.

The graph below shows the percentage of Australian exports to four countries from 1990 to 2012. Summarize the information by selecting and reporting the main features, and make comparisons where relevant.
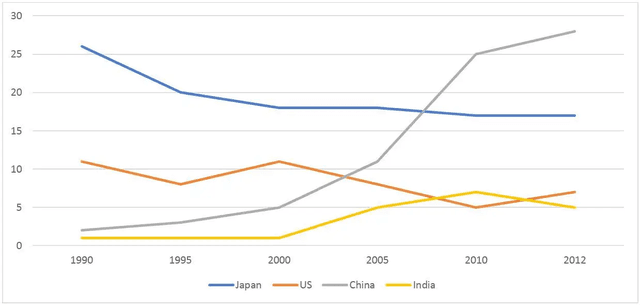
The line graph depicts the variation in the field of commercial exportation in the time interval of 1990 to 2012. It is clear from the graph that
China
have
Change the verb form
has
show examples
gained a huge change
whila
Correct your spelling
while
Japan
have
Correct subject-verb agreement
has
show examples
experinced
Correct your spelling
experienced
the lowest rate of
outcomes
Change the noun form
outcome
show examples
values throughout the same interval of time.
According to
what is shown,
China
has the highest reveal in exports, which
is
Unnecessary verb
apply
show examples
increased rapidly from 8% in 2000 to 38% in 2012. Unlike
China
, the sales in Japan
slide
Wrong verb form
slid
show examples
away from 35% in 1990 to 28% in 2012.
Moreover
, it can be deduced from the graph that both
Correct article usage
the Us
show examples
Us
Correct your spelling
US
show examples
and India differ slightly in profits of sales worldwide from 1990 to 2012.
To sum up
, we could say that
although
Japan had the largest number of exports in 1990,
China
succeeded
to surprise
Change preposition
in surprising
show examples
the world with their approximately 30% increase in 22 years.
Submitted by s116656m on

Unauthorized use and/or duplication of this material without express and written permission from this site’s author and/or owner is strictly prohibited. Excerpts and links may be used, provided that full and clear credit is given to Writing9 with appropriate and specific direction to the original content.

Common mistake: Your writing should be 150-250 words.
Vocabulary: Replace the words china with synonyms.
Vocabulary: The word "graph" was used 3 times.
Vocabulary: The word "increased" was used 2 times.
Topic Vocabulary:
  • Export percentages
  • Significant trends
  • Sharp increase/decrease
  • Relative distribution
  • Global economic changes
  • Trade agreements
  • Shifts in demand
  • Market dynamics
  • Year-on-year comparison
  • Bilateral trade relations
What to do next:
Look at other essays: