
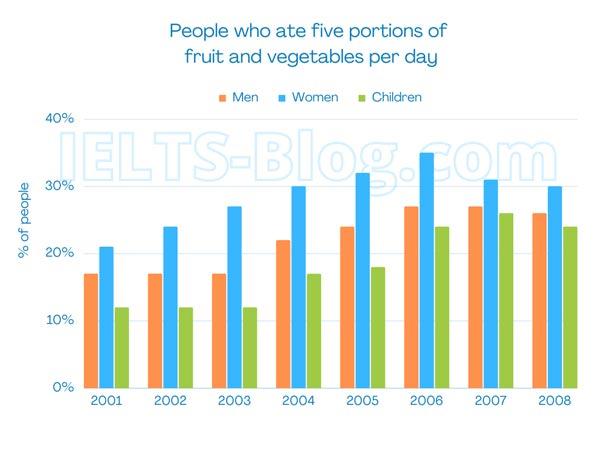
The bar chart illustrates the percentage of people (
Men
, Use synonyms
Women
, and Use synonyms
Children
) who ate five portions of fruit and vegetables per day in the UK from 2001 to 2008.
Use synonyms
Overall
, it is seen that the Linking Words
rate
of Use synonyms
women
who eat fruit and vegetables was the highest, and Use synonyms
this
was followed by Linking Words
Men
.
At the beginning of the period, the Use synonyms
rate
of Use synonyms
women
was over 20%, Use synonyms
while
the percentage of Linking Words
children
's intake was recorded to be only above 10%. After 2001, the percentage of Use synonyms
women
increased gradually to 2006 and reached a peak of approximately 35%. Use synonyms
On the other hand
, the figure for Linking Words
men
and Use synonyms
children
remained stable until 2003. The Use synonyms
rate
of Use synonyms
men
showed a steady rise of 7% from 2004 to 2006.
Use synonyms
At the end
of the period, all categories decreased steadily, but the Linking Words
rate
of Use synonyms
women
was still the highest. The Use synonyms
rate
of Use synonyms
children
who intake vegetables increased significantly compared to the beginning of the period.Use synonyms