
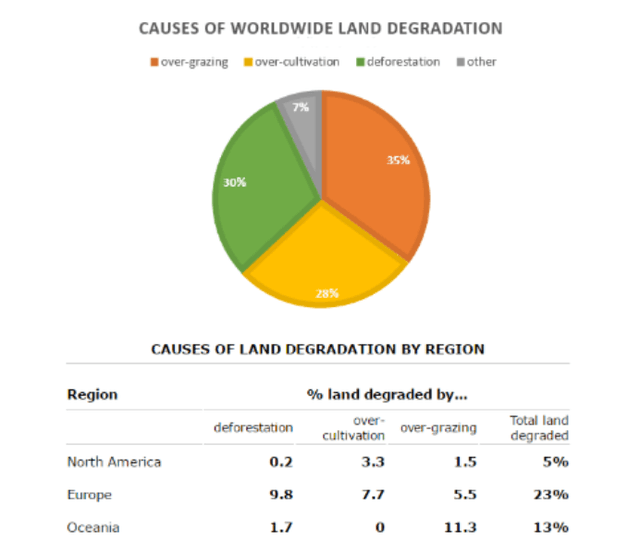
The pie chart illustrates the primary reasons for the lands which become less fertile,
while
the table shows how these reasons impacted 3 regions in the world during the 1990s. Linking Words
Overall
, it is evident that over-grazing is a primary driver compared to other causes, Linking Words
on the other hand
, Europe experienced the highest degradation of soil.
Over-grazing was responsible for 35% of the whole share, Linking Words
while
it stood at 30% for deforestation, Linking Words
therefore
, making it slightly higher than that of over-cultivation, at 28%. Other causes had less importance with merely 7%. Turning to regions, the proportion of Linking Words
the
degraded land in Europe was at its top Correct article usage
apply
with
23%, which is mainly caused by deforestation, Change preposition
at
with
9.8%.Change preposition
at
Furthermore
, The next most degraded land can be observed in Oceania with 13%, where Linking Words
while
over-grazing was the main reason for degradation with 11.3%, over-cultivation contributed none.Linking Words
Moreover
, in North America, as opposed to Oceania, the basic factor was over-cultivation, at 3.3%, Linking Words
however
, deforestation was at a mere 0.2%Linking Words