
The charts illustrate that the average person gets nutrients in a ratio of different types in every meal and snack in everyday life in the USA and it may be caused by unhealthy intake a lot.
Overall
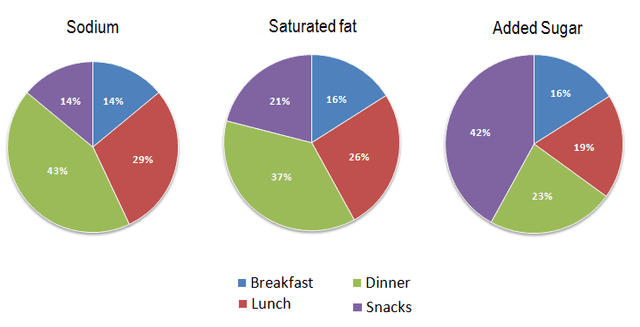
, the largest amount of sodium is 43% in dinner but the smallest quantity of salt is 14% in snacks.
Linking Words
However
, the consumption of sodium about 14% at breakfast and 29% at lunchtime is taken by the public of America. Linking Words
In addition
, the saturated fat intake in breakfast by 16% and the same quantity of sweetener is consumed in morning meals. Linking Words
Also
, the soluble fat diet is taken by the people in lunch 26% and it reduced by 7% of sugar.
Linking Words
Furthermore
, the saturated fat is 37% in dinner and it is decreased value by 14% of sugar. Linking Words
Moreover
, the fat foods are eaten by 21% of snacks and it is doubled value to add sweeteners.
Linking Words
Hence
, All data describes various changes in the nutrients taken by the public.Linking Words