
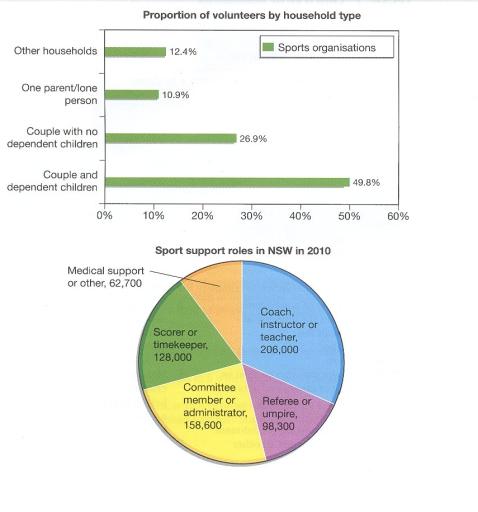
The bar graph illustrates the proportion of volunteers from New Zealand who provided assistance in 2010.The pie chart depicts the five types of jobs done in New South Wales in the same year by different skilled people.
Overall
, couple and dependent Linking Words
children
and coach, instructor or teacher were high in volume those performed different tasks. Use synonyms
Whereas
, medical support or other and other households is fewer in numbers. Linking Words
However
, couples with no dependent Linking Words
children
and committee members or administrators were less in counting who took part in various activities.
It is conspicuous that couples and dependent Use synonyms
children
49.80% worked as volunteers and Use synonyms
in contrast
from the pie chart coaches and instructors for teachers 206,000 in 2010. Linking Words
Furthermore
, 29.90% of couples with no Linking Words
children
dependent Use synonyms
children
took part and other side committee members or administrators total 158,600.
Probing ahead 10.90% one parent /lone person gave assistance to sports organisations, Use synonyms
on the other hand
, scorer or timekeeper and refugee or umpire were 128,000 and 96,300 respectively in 2010. Linking Words
Lastly
, other households and medical support or other 12.4% and 62,700 respectively.Linking Words