
The given chart demonstrates the
percentage
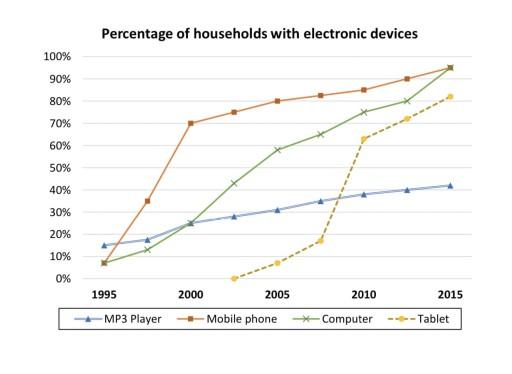
of households owning four types of electronic devices between 1995 to 2015.
In Use synonyms
overall
view mobile phone users and computer users, the initial Linking Words
percentage
is same and these Use synonyms
two
Use synonyms
categories
strike at peak position Use synonyms
at the end
of the given interval of the Linking Words
year
.Use synonyms
Moreover
, The lowest Linking Words
percentage
achieved Use synonyms
at the end
of the given Linking Words
year
interval is for MP3 Players.In the forthcoming paragraph, I explain deeply Use synonyms
this
chart information.
Linking Words
To begin
with,We rectify that there are four types of people who own household devices from the span of 1995 to 2015.Linking Words
Firstly
Linking Words
two
Use synonyms
categories
mobile phones and computers peaked at their highest position between 1995 to 2015 and the Use synonyms
percentage
was Use synonyms
initially
the same nearly about 8% for both Linking Words
categories
and suddenly increased to 70% in the Use synonyms
year
2000.Use synonyms
However
,personal computer users gradually increase from the initial Linking Words
year
to the end of the Use synonyms
year
.
Other than that,the Popularity of the Use synonyms
two
Use synonyms
categories
tablet and mp3 player is less in comparison to the other Use synonyms
two
Use synonyms
categories
player Use synonyms
initially
started at 15% and in the Linking Words
year
2000 the computer and mp3 user percentages were the same at about 25% and Use synonyms
then
the mp3 player popularity Linking Words
further
increased slowly ended nearly about 32% in 2015.Linking Words
In addition
, there were no people owing tablets before the Linking Words
year
2000 and it became popular after the Use synonyms
year
2000 and peaked at 72 % in the Use synonyms
year
2015.Use synonyms