
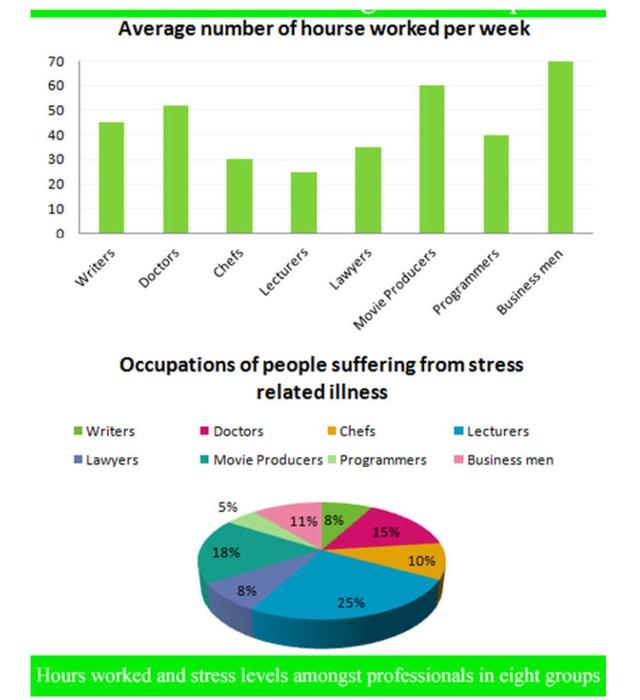
The bar chart and pie chart illustrate the number of
work
Use synonyms
hours
per week and the proportion of Use synonyms
stress
among eight different occupations.
Use synonyms
Overall
, it can be seen that businessmen spend their lifetime working the most, Linking Words
while
a majority of lecturers are suffering from illness caused by Linking Words
stress
.
In a week, the businessmen dedicate their time to Use synonyms
work
almost 70 Use synonyms
hours
. Movie producers came second place with 60 Use synonyms
hours
. Only roughly 25 Use synonyms
hours
were spent by lecturers. The other jobs Use synonyms
work
less than 60 Use synonyms
hours
a week and are different by 5 Use synonyms
hours
.
Use synonyms
On the other hand
, the lecturers seem to get Linking Words
Use synonyms
stress
more than other jobs, which occupy 25%. Followed by entertainment producers and doctors at 18% and 15% respectively. Chefs and lawyers are likely to have equal Wrong verb form
stressed
stress
from their Use synonyms
work
which is represented at 8%. Use synonyms
However
, programmers are affected by Linking Words
stress
the least which is only 5%.Use synonyms