You should spend about 20 minutes on this task. The bar chart below shows the numbers of men and women attending various evening courses at an adult education centre in the year 2009. The pie chart gives information about the ages of these course participants. Write a report for a university, lecturer describing the information shown below. Summarise the information by selecting and reporting the main features and make comparisons where relevant. You should write at least 150 words.

You should spend about 20 minutes on this task.

The bar chart below shows the numbers of men and women attending various evening courses at an adult education centre in the year 2009. The pie chart gives information about the ages of these course participants.

Write a report for a university, lecturer describing the information shown below.

Summarise the information by selecting and reporting the main features and make comparisons where relevant.

You should write at least 150 words.
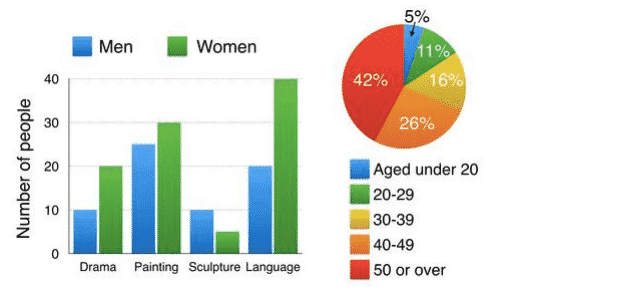
The bar graph depicts males' and females' different evening classes participating numbers in an adult learning
center
Change the spelling
centre
show examples
in 2009. The pie graph illustrates the ages of those lessons' enrollment.
Overall
,
it is clear that
women in language, painting, and drama courses were the dominant. Only the sculpture was the exception. When it comes to the age group, the elderly students tended to join those lessons the most. Looking at the charts more closely, one can see that the female students in the language course were twice the male students' numbers, and so did the drama's number.
Sculpture
Add an article
The sculpture
show examples
was the least popular class in the
center
Change the spelling
centre
show examples
, and just 15 people were taken
this
one. In the age groups, the 50 or over category accounted
at
Change preposition
for
show examples
42% and the teenager group was in 5%. You can see a phenomenon in it. Age was related to the rate of
sign up
Add a hyphen
sign-up
show examples
for courses. The youngsters were not interested in those events, and older people were more likely to attend.
Submitted by edward300225 on

Unauthorized use and/or duplication of this material without express and written permission from this site’s author and/or owner is strictly prohibited. Excerpts and links may be used, provided that full and clear credit is given to Writing9 with appropriate and specific direction to the original content.

Vocabulary: Only 4 basic words for charts were used.
Vocabulary: The word "graph" was used 2 times.
Vocabulary: Use several vocabularies to present the data in the second paragraph.
What to do next:
Look at other essays: