
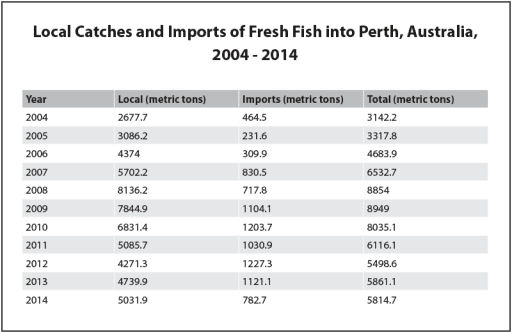
The illustration presents information
in
metric Change preposition
on
tons
of domestic catches and fresh fish brought from abroad into Perth, Australia from 2004 to 2014.
Use synonyms
Overall
, 2009 had the highest sum of metric Linking Words
tons
followed by 2008 Use synonyms
whereas
the lowest were in 2004 and 2005. Linking Words
Moreover
, 2008 had the most catches as compared to Linking Words
rest
of the years whilst 2012 had the least catches. For the years 2004 to 2014, all imports were lower than local catches.
In 2004, domestic fresh fish of 2677.7 caught were higher than 464.5 metric Correct article usage
the rest
tons
of imports; Use synonyms
However
, in Linking Words
this
year the Linking Words
least
total was noticed. 309.9 metric Correct word choice
lowest
tons
were shipped from abroad in 2006 Use synonyms
while
2031.9 metric Linking Words
tons
were produced locally.
Use synonyms
Additionally
, 2013 had a total of 2031.9 and Linking Words
on the other hand
, 2004 had 3142.2. Local catches in 2008 were well over catches in 2005 and produce in 2007 was almost 10000 just over caches in 2006.Linking Words