
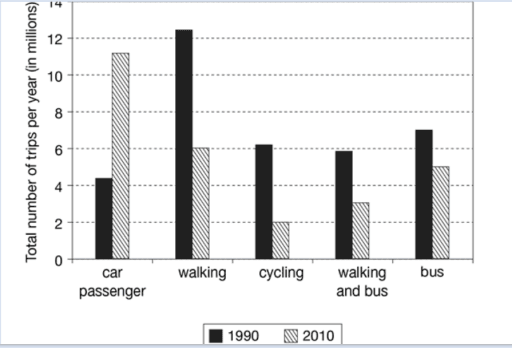
The chart provides data on the different methods of
transportation
used by a country's offspring in order to get to school and how frequently they were used, over 20 years. The graph clearly indicates relationships between a decline in Use synonyms
usage
of environmentally friendly methods and public Correct article usage
the usage
transportation
by owning a personal vehicle in the household.
Use synonyms
Firstly
, the number of car passenger children grew dramatically after they were first introduced in the graph in 1990, jumping from 4 Linking Words
million
trips per year to almost 11 Use synonyms
million
in just 2010. Use synonyms
On the other hand
, the main method of travelling which was walking, peaked in 1990 and has been in a drastic fall since Linking Words
then
.
Another significant change is the number of cyclists, a device very common in each family, Linking Words
which
6 Change preposition
in which
million
trips were made by children in order to get to their destination , Use synonyms
has
Correct pronoun usage
which has
also
been in a decline with the number of trips reaching 2 Linking Words
million
.
A well-known way of Use synonyms
transportation
in schools, Use synonyms
bus
and a combination of walking and Use synonyms
bus
have not faced a magnificent change compared to other modes. Use synonyms
With buses
only dropped from over 6 Change preposition
Buses
million
to almost 5 Use synonyms
million
from 1990 to 2010, and the mixture of walking and Use synonyms
bus
Use synonyms
falling
from almost 6 Wrong verb form
fell
million
to 3 Use synonyms
million
.
In conclusion, the popular methods of Use synonyms
transportation
during 1990 were much more environmentally friendly and cleaner, Use synonyms
such
as walking, cycling and taking the Linking Words
bus
. But eventually were replaced by personal vehicles in 2010. But not totally, only reduced.Use synonyms