
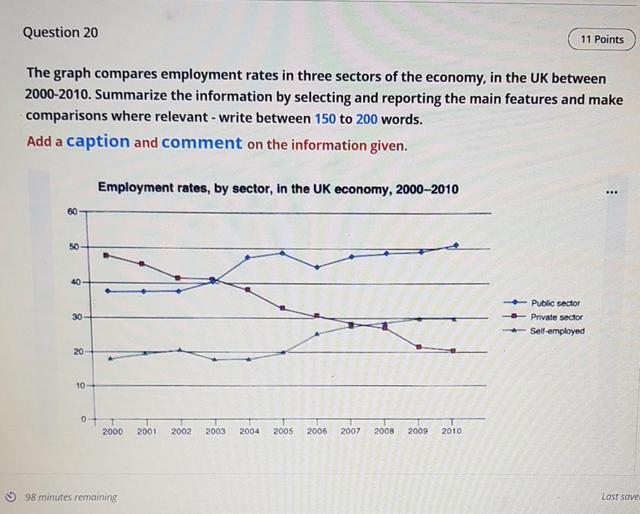
The given graph represents the amount of
hire
in three parts of the economy in the UK, over a ten Fix the agreement mistake
hires
Use synonyms
years
period from 2000 until 2010. Fix the agreement mistake
year
Overall
, what stands out from the graph is that there Linking Words
were
considerable growth in the employment of both the self-employed and the public Change the verb form
was
sector
, whilst the employment rate of the private Use synonyms
sector
fell gradually. Another interesting point is that the public Use synonyms
sector
had the maximum hire rate in 2010, Use synonyms
nevertheless
, in 2000 and 2003, the self-employment Linking Words
sector
had the minimum rate.
Looking at the details, as regards the public Use synonyms
sector
, having remained stable in the first two Use synonyms
years
by around 38 per Use synonyms
cent
, Use synonyms
then
there was grew slightly for three Linking Words
years
, at which it dropped in 2006, Use synonyms
then
the figure increased gradually to just over 50. If look at self-employment, started at approximately 18 in 2000, Linking Words
then
increased slightly to 20 in 2002, for the next year, the figure fell to around 18 per Linking Words
cent
in 2003. There went up slightly to 30 per Use synonyms
cent
in 2009 and following that it remained stable for the Use synonyms
last
year in 2010.
Linking Words
On the other hand
, Linking Words
the
employment Correct article usage
apply
of
the private Change preposition
in
sector
started at around 48 per Use synonyms
cent
which was the biggest number in 2000, Use synonyms
then
it decreased gradually for the next two Linking Words
years
, having remained stable between 2002 and 2003, next it gradually decreased to just under 30 per Use synonyms
cent
in 2008, Use synonyms
then
there was a plunge in 2009 , and from 2009 to 2010 there was negligible fall.Linking Words