
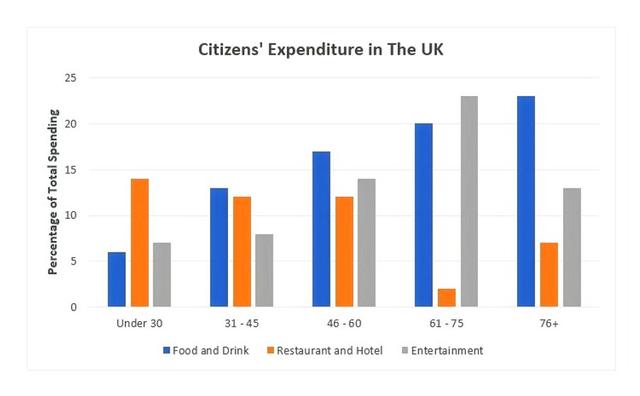
The bar chart provides data on spending on three different categories by five age sections of UK people in a concrete year.
It is clear that
food and drink represented the biggest quantity in total and Linking Words
accordingly
of the 76+ years group, roughly 23 Linking Words
percent
. Change the spelling
per cent
Whereas
the same people spent only just under 8% on entertainment, Linking Words
thus
showing a principal spread of expenses. The second amount of output in that sample was restaurants and hotels - circa 13%.
Linking Words
According to
the figures, the lowest number was for entertainment paying out in the 61-75 cluster, approximately a mere 2%. Despite Linking Words
this
, their outlay for restaurants and hotels was almost the highest - around 23%. The second largest charge in the same unification was food and drink with a share of 20% exactly.
Linking Words
Overall
, Linking Words
while
expenditure categories of people under 60 years of age were evenly distributed and included a significant percentage of spending on entertainment, the older generation forked out money unevenly.Linking Words