
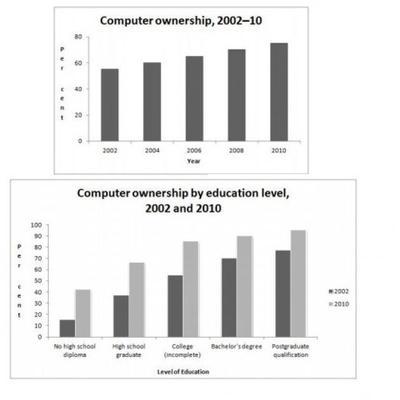
The bar charts illustrate information about the percentage of desktop
owners
Use synonyms
during
2002 to 2010(2002, 2004, 2006, 2008 and 2010). The second one expresses their 5 levels of study of Change preposition
from
degree
of the Add an article
the degree
owners
, including absent of Use synonyms
highschool
degree, graduated in the Use synonyms
Use synonyms
highschool
level, Correct your spelling
high school
unsuccessed
in college, Bachelor’s degree and Postgraduate qualification, at the beginning year(2002) and the Correct your spelling
successes
last
year(2010) of observing.
Linking Words
Overall
, it is noticeable that both graphs show the increasing trends during Linking Words
this
Linking Words
8 years
period. Focusing more on the first chart, the Correct your spelling
8-year
computer
Correct quantifier usage
number of computer
owners
increasedUse synonyms
5
Change preposition
by 5
Use synonyms
percents
per Fix the agreement mistake
percent
each
period, starting from 55 Correct determiner usage
apply
Use synonyms
percents
in 2002 and Fix the agreement mistake
percent
end
up Wrong verb form
ending
with
75 Change preposition
at
Use synonyms
percents
in 2010.
Turning to the second graph, there Fix the agreement mistake
percent
are
Correct subject-verb agreement
is
also
Linking Words
in
Change preposition
apply
the
increasing trend of people who own Correct article usage
an
the
computer. Correct article usage
a
Furthermore
, in the lower education levels(ungraduated from Linking Words
Use synonyms
highschool
and in the Correct your spelling
high school
Use synonyms
highschool
level), the data reveals that there were twice more of the Correct your spelling
high school
owners
in 2010 compared to the year 2002. Use synonyms
However
, there Linking Words
were
a Change the verb form
was
slightly
increase in the higher levels of study which is around Change the adverb
slight
20
Correct article usage
a 20
Use synonyms
percents
Fix the agreement mistake
percent
increased
.Replace the word
increase