
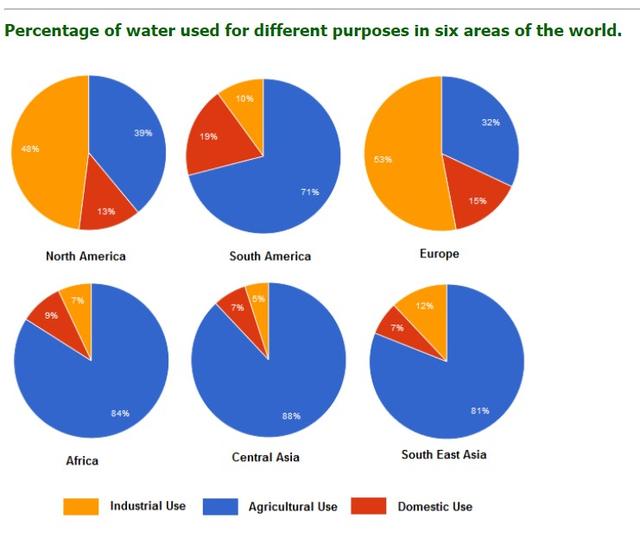
The data presented in the pie charts delineate the distribution of
water
resources allocation for various purposes across six countries worldwide.
Use synonyms
Overall
, Linking Words
it is clear that
agricultural usage predominates in four out of the six states. Linking Words
Conversely
, industrial and domestic utilization is most prevalent in three distinct regions, respectively.
Linking Words
To begin
with, Linking Words
water
allocation for agricultural purposes exhibits a substantial percentage exceeding 70%. Central Asia stands out as the primary consumer of Use synonyms
water
for agricultural activities at 88%, trailed by Africa at 84%, Use synonyms
South East
Asia at 81%, and South Correct your spelling
Southeast
America
at 71%. Use synonyms
By contrast
, North Linking Words
America
and Europe allocate just under 50% of their Use synonyms
water
resources for agricultural use, with figures of 39% and 32%, respectively.
Use synonyms
In contrast
, industrial and domestic Linking Words
water
consumption percentages are lower than those for agriculture. Europe leads in industrial Use synonyms
water
utilization at 53%, followed by North Use synonyms
America
at 48%, and South East Asia at 12%. Use synonyms
Conversely
, domestic Linking Words
water
usage is highest in South Use synonyms
America
at 19%, followed by Europe at 15% and North Use synonyms
America
at 13%.Use synonyms