
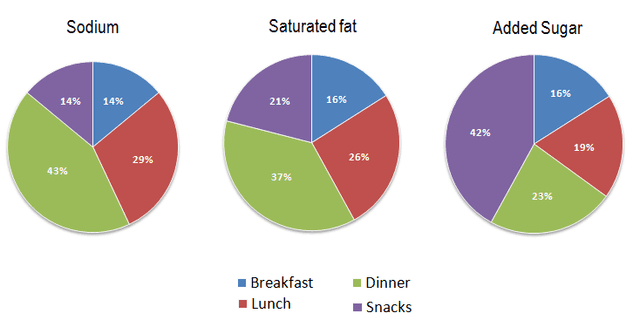
The pie charts illustrate the proportion of three types of nutrients in different meals comprising of breakfast,
lunch
, dinner and Use synonyms
snacks
.
Use synonyms
Overall
, Linking Words
it is clear that
most people tend to consume both sodium and unhealthy fat during supper. Linking Words
However
, Linking Words
snacks
use added Use synonyms
sugar
as their main component compared to others.
Use synonyms
Firstly
, sodium or salt is consumed mostly in evening meals with 43% followed by Linking Words
lunch
which is about 29%. Both the saltiness of breakfast and Use synonyms
snacks
represent 14%. Saturated fat has the same trend as sodium which dinner is in the first place and Use synonyms
lunch
comes the second. Use synonyms
Whereas
fat seems to be used as a main ingredient more than Linking Words
snacks
, at 21% and 16% respectively.
Use synonyms
Finally
, added Linking Words
sugar
is put in Use synonyms
snacks
as their key component, registering 42%. Supper has almost the half amount of Use synonyms
sugar
in Use synonyms
snacks
. Use synonyms
Moreover
, the amount of Linking Words
sugar
in breakfast is equal to the fat, at 16%, and Use synonyms
Lunch
contains Use synonyms
sugar
at 19%.Use synonyms