
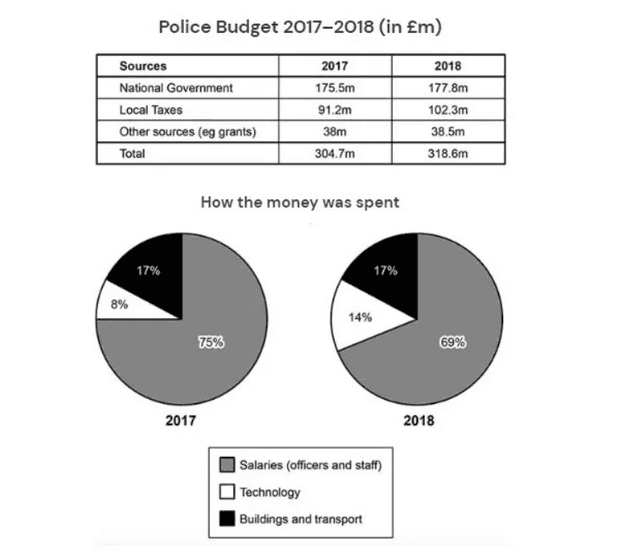
The table provides the breakdown of different sources of police budget, and the pie chart demonstrates its distribution in 2017 and 2018 in a region in Britain.
Overall
, Linking Words
it is clear that
the majority of funds come from the national government, which is significantly higher than local taxes and other sources Linking Words
such
as grants. Linking Words
Also
, most of the money was spent on the wages of police officers and staff. Notably, total income increased throughout the period shown.
In 2017, about 175m pounds came from the national government, which experienced a slight increase in the next year, reaching just below 178m pounds. Linking Words
Also
, incomes from local taxes and other resources followed a similar trend, with the highest rise witnessed by local taxes, climbing by more than 10 million pounds.
Remaining constant between 2017 and 2018, building and transport accounted for 17% of the money spent, making it slightly more than technology at 8%, which had approximately doubled by 2018. Interestingly, salaries made up three out of every four expenses; Linking Words
nevertheless
, Linking Words
this
decreased in 2018 by about 6%.Linking Words