You should spend about 20 minutes on this task. The charts below show the percentage of Australian men in three age groups who were employed in 1984, 2001 and 2014.

You should spend about 20 minutes on this task.

The charts below show the percentage of Australian men in three age groups who were employed in 1984, 2001 and 2014.
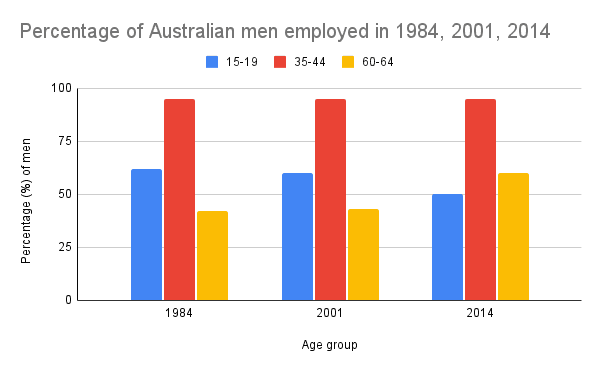
The bar graph shows the percentage of Australian men
were
Correct pronoun usage
who were
show examples
employed in 1984,2001,2014
according to
their age group. Age groups are shown young,middle-aged and old people. As we can see in 1984
the
Correct article usage
apply
show examples
65
percent
if
Correct your spelling
of
show examples
teenagers were employed.
This
proportion stayed
same
Correct article usage
the same
show examples
in 2001,but it dropped
of
Change preposition
by
show examples
about 50
percent
Change the spelling
per cent
show examples
in 2014.During the 13
years
Add a comma
years,
show examples
this
percent
Replace the word
percentage
show examples
decreased suddenly. Middle-aged men
worjed
Correct your spelling
worked
all the years.The second group is shown the highest rate and
remain
Correct subject-verb agreement
remains
show examples
stable during these years.There is no decrease or increase in the rate of people. They display about 80% from 1984 to 2001. The third
catefory
Correct your spelling
category
is old people.It is noticeable
thta
Correct your spelling
that
the least
percent
Replace the word
percentage
show examples
was shown in the oldest age. It was under 50%
percent
in 1984.It was followed by a sudden increase of 60 by 2014. In conclusion,
bar
Add an article
the bar
show examples
graph shows middle-aged men worked over the all period.Teenagers
also
liked working,but
2014
Change preposition
in 2014
show examples
they were second
higest
Correct your spelling
highest
.There is
sharp
Add an article
a sharp
show examples
contrast in the oldest employees.
Submitted by englishgate995 on

Unauthorized use and/or duplication of this material without express and written permission from this site’s author and/or owner is strictly prohibited. Excerpts and links may be used, provided that full and clear credit is given to Writing9 with appropriate and specific direction to the original content.

Conclusion: The conclusion is too long.
Basic structure: Use less body paragraphs.
Basic structure: Change the second paragraph.
Basic structure: Change the fifth paragraph.
Vocabulary: Replace the words percent with synonyms.
Vocabulary: Rephrase the word "percentage" in your introduction.
Vocabulary: The word "graph" was used 2 times.
Vocabulary: The word "shows" was used 2 times.
Vocabulary: The word "decreased" was used 2 times.
Vocabulary: The word "increase" was used 2 times.
Vocabulary: The word "about" was used 2 times.
Vocabulary: Use several vocabularies to present the data in the second paragraph.
Vocabulary: Use several vocabularies to present the data in the fifth paragraph.
Topic Vocabulary:
  • employment trends
  • age groups
  • significant changes
  • employment rates
  • economic shifts
  • technological advancements
  • societal changes
  • policy-making
  • workforce participation
  • labor market dynamics
  • demographic shifts
  • career longevity
  • early retirement
  • job market competitiveness
  • technological unemployment
What to do next:
Look at other essays: