
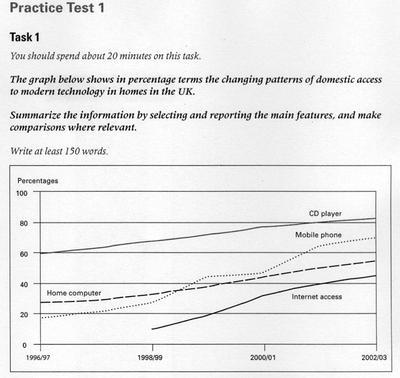
. The given line graph illustrates a variation in household access to four modern technologies in homes in the UK in percentage values between the
years
1996 to 2003 .
Use synonyms
Overall
, the availability of Linking Words
CD
Use synonyms
players
, mobile phones and home computers in the domestic environment had a steady rise during the whole period . Use synonyms
Although
,internet access appeared later it Linking Words
also
rose steadily. Linking Words
Furthermore
, Linking Words
CD
Use synonyms
players
were recorded ,as the modern Use synonyms
device
with the highest home accessibility throughout the period.
In detail, Use synonyms
CD
Use synonyms
players
were the highest popular modern Use synonyms
device
in the houses in the Use synonyms
years
1996/97 with 60 % in percentage Use synonyms
while
that amount climbed up gradually to just over 80% in the Linking Words
years
2002/2003. Home computers, Use synonyms
although
,recorded a near 30% in 1996/97 Linking Words
similarly
followed the same gradual increase as Linking Words
CD
Use synonyms
players
throughout the period to reach just over 50% in the Use synonyms
years
2002/03.
Use synonyms
Moreover
, mobile phones were the least available Linking Words
device
in the domestic environment in 1996/97 with just below 20% of the household ,but Use synonyms
it
became the second most popular Correct pronoun usage
they
device
in 2002/03 with a value of around 70%. Use synonyms
However
,till 1998/1999 there was a gradual rise in the accessibility of it domestically to just below 30% and Linking Words
then
the level surged near to 45% within the next year and was followed by a slight increase in the level till 2000/2001. After that, it rose significantly during the first half of the next year , followed by a gradual growth to post approximately 70% availability in houses in the year 2002/2003.Linking Words