
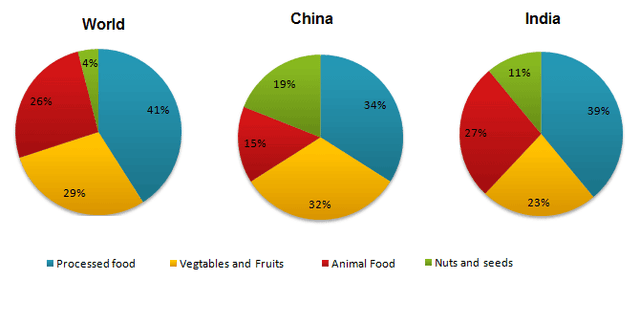
The pie chart below illustrates the percentage of
food
Use synonyms
consumption
Use synonyms
such
as processed Linking Words
food
,vegetables and fruits,animal Use synonyms
food
,nuts, and seeds in the Use synonyms
world
in 2008 compared to two countries, China and Use synonyms
India
.
Use synonyms
Overall
, Linking Words
it is clear that
processed Linking Words
food
is the leading Use synonyms
consumption
in both countries and the Use synonyms
world
. The less popular is nuts and seeds, which don't consist of even one-fifth part.
On the one hand, the Use synonyms
consumption
of Use synonyms
food
Use synonyms
as
nuts and seeds was lower in the Correct quantifier usage
such as
world
than in China and Use synonyms
India
, which consisted of four Use synonyms
percentages
.Replace the word
per cent
Linking Words
Also
vegetables and fruits provided somewhat one-third dietary requirements of Add a comma
Also,
the
Chinese citizens and precisely 23 Correct article usage
apply
percentages
of Indians. The Replace the word
per cent
world
average for fruit and vegetable Use synonyms
consumption
was just below 30 Use synonyms
percent
.
Change the spelling
per cent
Furthermore
, animal Linking Words
food
is the second Use synonyms
popular
Correct quantifier usage
most popular
consumption
in Use synonyms
India
, which is 27 Use synonyms
persentages
. At the same time Correct your spelling
percentages
percentage
the
animal Correct article usage
apply
food
Use synonyms
consumption
in the Use synonyms
world
consists of one Use synonyms
percent
lower than in Change the spelling
per cent
India
.Use synonyms