
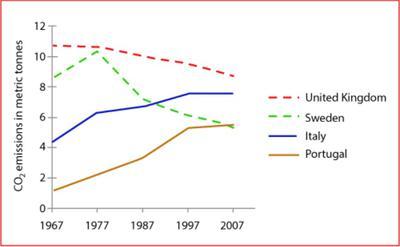
The given Picture depicts the information
of
Change preposition
on
Production
of co₂ by one individual in the Correct article usage
the Production
UK
, Use synonyms
Sweden
, Italy and Portugal during the period Use synonyms
of
1967 and 2007.
Change preposition
between
Overall
, it can be seen from the chart that, Linking Words
Use synonyms
Correct article usage
the Uk
Uk
and Correct your spelling
UK
Sweden
showed Use synonyms
decline
, Add an article
a decline
whereas
Italy Linking Words
as well as
Portugal indicated growth In carbon dioxide as time Linking Words
pass away
.
In 1967, Wrong verb form
passed
Use synonyms
Correct article usage
the Uk
Uk
was the Correct your spelling
UK
one
country, which produced the highest amount of Correct pronoun usage
apply
co2
Correct your spelling
CO2
by
around 10.5 metric Change preposition
apply
tonnes
followed by Use synonyms
Sweden
approximately at 8.2 Use synonyms
tonnes
. Use synonyms
However
, in 1977 the Production in Linking Words
Sweden
Swelled Significantly and Stayed above 10 Use synonyms
tonnes
, after that, it tumbled Use synonyms
down
drastically and reached below 6 Change preposition
apply
materic
Correct your spelling
metric
tonnes
in 2007. The Use synonyms
Use synonyms
Uk
Correct your spelling
UK
also
indicated decline growth and Stayed at roughly 8.3 Linking Words
tonnes
.
Use synonyms
According to
the chart, not only Italy but Linking Words
aiso
Portugal indicated Correct your spelling
also
upward
trend. In 1967, Correct article usage
an upward
Portugal
Production of CO2 Started at nearly 1.8 metric Change noun form
Portugal's
tonnes
and rose greatly till 2007 and reached Use synonyms
at
the Same level Change preposition
apply
of
Change preposition
as
Sweden
which was below 6 Use synonyms
tonnes
. Just same as Portugal, Use synonyms
the
Italy Correct article usage
apply
Showed
Verb problem
Had
same
Change the article
the same
increasement
from 4.1 Correct your spelling
increase
tonnes
in 1967 to nearly 7.8 in 2007.Use synonyms