
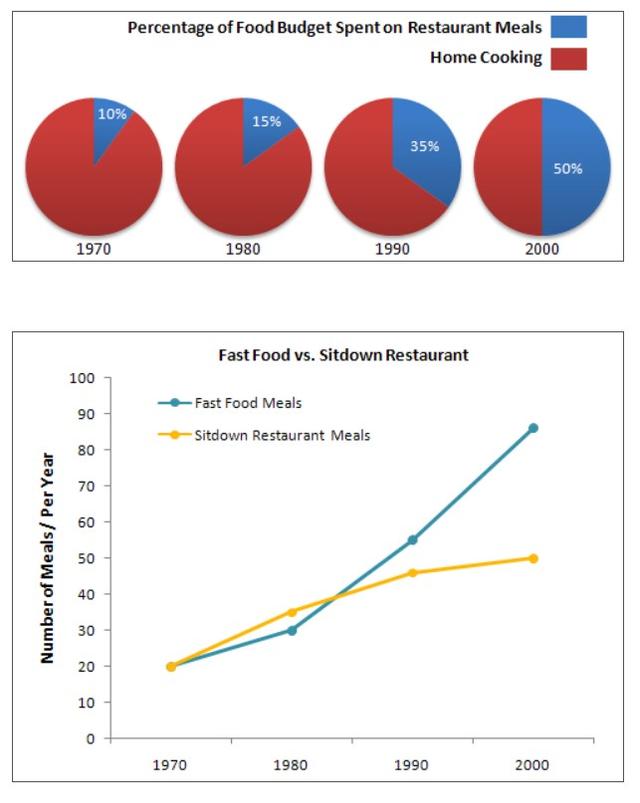
The pie charts represent the proportion of the average household's allotted money for eating out in
a
Correct the article-noun agreement
a restaurant
restaurants
restaurants
in four distinct years (1970 to 2000), Use synonyms
while
the line graph compares the total number of foods consumed by the family in 2 different Linking Words
restaurants
(fast food and sit-down Use synonyms
restaurants
).
Use synonyms
Overall
, we can see that the budget for eating in Linking Words
the
Correct article usage
apply
restaurants
increased over the given period, Use synonyms
whereas
cooking at home declined. Linking Words
Moreover
, Linking Words
although
the two Linking Words
restaurants
we popular in the initial year, eating Use synonyms
in
fast Change preposition
apply
foods
became more famous Fix the agreement mistake
food
at
the final year.
In detail, in 1970, Change preposition
in
home cooked
meals were the favourite family's choice of food, which accounted for 90% Add a hyphen
home-cooked
compared
to only 10% of eating out in a restaurant. Change preposition
of compared
However
, by 2000, the rate Linking Words
Add a missing verb
had begun
begun
to increase for the latter, wherein both of the options had 50%.
Meanwhile, the popularity of both fast Add the auxiliary verb
began
has begun
foods
and sit-down Fix the agreement mistake
food
restaurants
rose in the years covered. To be specific, both stood at 20 meals per year in 1970, after which it experienced an increase in the following decades with fast food having almost 90 servings daily and 50 servings for sit-down Use synonyms
restaurants
.Use synonyms