
The charts and graph beneath illustrate
that
the expenditure on fast food in Britain and Correct word choice
apply
also
represent their Linking Words
consumption
The given chart Use synonyms
illustrate
Change the verb form
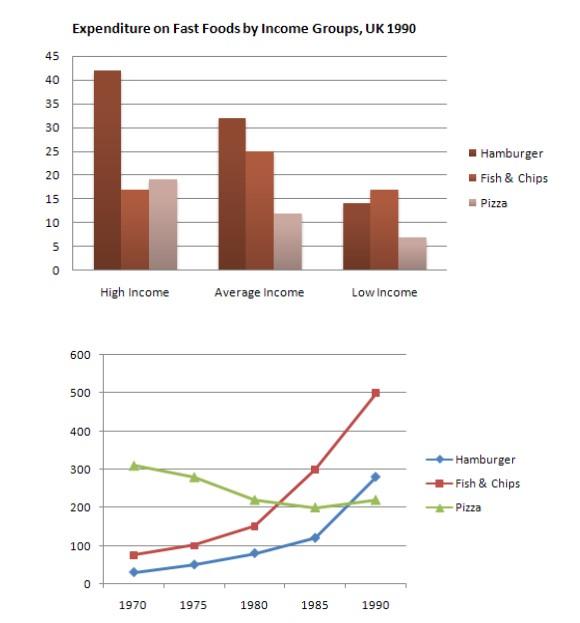
illustrates
that
the expenditure on fast food Correct word choice
apply
according to
Linking Words
income
groups and the graph represents the Use synonyms
consumption
of fast food from 1970-1990.
Expenditures of Use synonyms
High
Add a hyphen
High-income
income
Use synonyms
group
on Hamburger is high more than 40 pence per week as compared to Use synonyms
average
Correct article usage
the average
income
and Use synonyms
low
Add a hyphen
low-income
income
Use synonyms
group
which is (less than 35 and just under 15).Use synonyms
Average
Correct article usage
The average
income
Use synonyms
group
spent 25 pence on Fish and pizza which is more than average and Use synonyms
low
Add a hyphen
low-income
income
Use synonyms
group
which is (just under 20n for both).
The given graph Use synonyms
illustrate
that the Change the verb form
illustrates
consumption
of Hamburger and Pizza Use synonyms
increasing
from (1970-1990) from (100-200 Wrong verb form
increased
grams
) .but the Use synonyms
consumption
of fish and chips Use synonyms
decrease
Wrong verb form
decreased
up
to 1985 from (300-200 Change preposition
apply
grams
) but its Use synonyms
slightly
increase from(1985-1990) up to 250 Change the adverb
slight
grams
. So the Use synonyms
overall
Linking Words
consumption
and expenditure of hamburgers in price or in Use synonyms
grams
are increase as compared to Use synonyms
other
two groups.Correct article usage
the other