
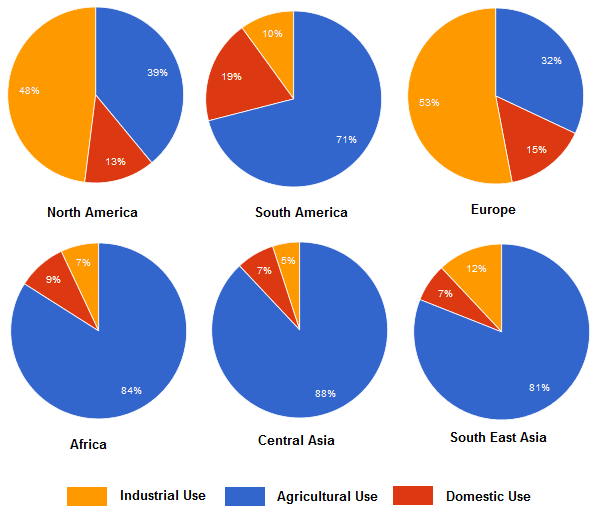
The pie charts present information related to
water
consumption by three main sectors in six Use synonyms
regions
of the world.
Let’s explore Use synonyms
further
how Linking Words
water
is used across these Use synonyms
regions
. It is evident that agriculture commands the largest share of Use synonyms
water
in four out of the six Use synonyms
regions
, Use synonyms
whereas
industry is the biggest Linking Words
water
user in the other two.
Use synonyms
Water
use for agricultural purposes is the highest in Central Asia with a whopping 88% share, Use synonyms
however
, at the other end of the scale, agriculture accounts for only 32% of Europe’s Linking Words
water
budget. Use synonyms
Industry
is the leading Add an article
The industry
water
user in both Europe (53%) and North America (40%), but Use synonyms
this
sector’s demands are minimal in Central Asia (5%), Africa (7%), South America (10%) and South East Asia (12%). Linking Words
Water
is diverted for domestic purposes the most in South America with a 19% share and with lower shares across other Use synonyms
regions
reflecting a global reality that domestic Use synonyms
water
use is never a leading Use synonyms
water
user.
Use synonyms
Finally
, Linking Words
water
consumption patterns are indicative of the Use synonyms
Use synonyms
regions’
economies: the developed West allocates more Correct your spelling
region’s
water
to “fuel” its industry, Use synonyms
whereas
the “Global South” pumps Linking Words
water
into its field to develop its agrarian-based economy.Use synonyms