
This
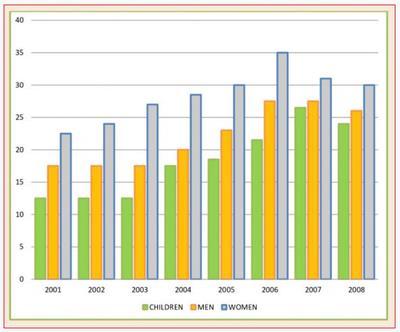
bar chart illustrates information about the proportion of men, women and Linking Words
children
who were consuming five servings of Use synonyms
fruit
and vegetable a day in the United Kingdom for seven years, from the year 2001 Use synonyms
till
2008.
Change preposition
to
Overall
, women experienced the highest percentage of eating Linking Words
fruit
and vegetables, Use synonyms
while
Linking Words
children
accounted for the lowest proportion. Use synonyms
Furthermore
, there is a significant increase in the Linking Words
numbers
of consuming these food items.
The percentage of women who ate Fix the agreement mistake
number
fruit
and vegetables started at just over 20% in 2001. Use synonyms
This
Linking Words
then
rose Linking Words
up
steadily to a peak of 36% in 2006. In the final year, it dropped down to 30%.
In terms of men and Change preposition
apply
children
eating Use synonyms
fruit
and vegetables, the rate remained relatively the same in the first three years, with approximately 17% and 12%. From Use synonyms
this
point, men climbed gradually to a peak of 27% in both 2006 and 2007, which Linking Words
finally
dropped to 26%. Linking Words
Children
experienced an upward trend to 25% in 2007 and decreased to 24% in the final year.Use synonyms