
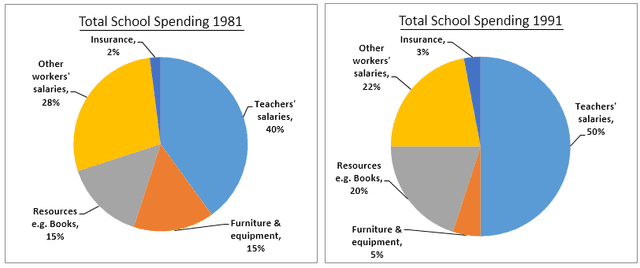
The given pie charts illustrate they other workers’
Use synonyms
proportion
of spending in some UK schools in three different years.
In general, we can see that teachers’ Add an article
the proportion
salaries
always were top position. In the Use synonyms
meantime
we can Add a comma
,meantime
also
view insurance as Linking Words
bottom
point.
Beginning with spending Add an article
a bottom
the bottom
of
1981 and 1991 we can observe that Change preposition
in
firstly
teachers’ Linking Words
salaries
were spent 40% in 1981,Use synonyms
however
Linking Words
Add the comma(s)
,
was
rose by 10% in Unnecessary verb
apply
Linking Words
next
decade. Correct article usage
the next
Secondly
Linking Words
Add a comma
,
salaries
were paid virtually over 20% in the both of years. Use synonyms
Linking Words
Finally
we can Add a comma
,Finally
also
witness that Resources e.g books and Furniture or equipment were utilized approximately between 5% and 20% in those years.
Moving on to Linking Words
Use synonyms
proportion
spending of Correct article usage
the proportion
2001
we can see that they spent 45% Change preposition
in 2001
to
teachers’ Change preposition
on
salaries
. It is Use synonyms
also
worth notice Linking Words
Use synonyms
proportion
of Insurance and Resources books spending Correct article usage
the proportion
were
virtually the same ( 8% by 9%) .Correct subject-verb agreement
was
Next
, when it comes to other workers’ Linking Words
salaries
we can Use synonyms
also
view that Linking Words
Use synonyms
proportion
of spending was reduced Correct article usage
the proportion
up
to 10% in 2001. Change preposition
by up
Linking Words
Additionally
they spent 23% on Furniture and equipment in 2001.Add a comma
,Additionally