the chart below gives information on the percentage of british people giving money to charity by age range for the years 1990 and 2010. summarise the information by selecting and reporting the main features

the chart below gives information on the percentage of british people giving money to charity by age range for the years 1990 and 2010.

summarise the information by selecting and reporting the main features
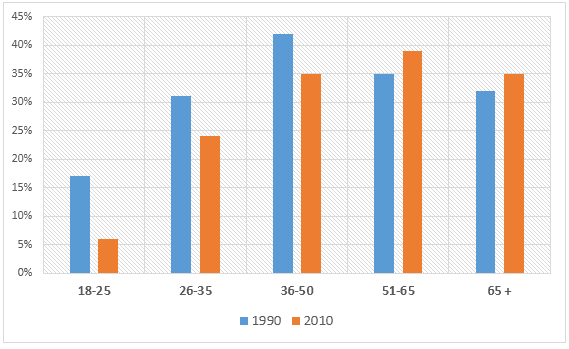
The bar chart illustrates the percentage of people funding
money
to charity by 5 different age ranges for the years 1990 and 2010 in
UK
Correct article usage
the UK
show examples
.
overall
,
the
Correct article usage
apply
show examples
people in the past
has
Correct subject-verb agreement
have
show examples
given more
money
compared to
present
Add an article
the present
show examples
.the pattern differs at the age
50
Change preposition
of 50
show examples
in the two years. In 1990,above 40% of the people of
age
Add a comma
,age
show examples
36-50 donated more
money
in
figure
Add an article
the figure
show examples
.the 18-25s contributed less
money

Unauthorized use and/or duplication of this material without express and written permission from this site’s author and/or owner is strictly prohibited. Excerpts and links may be used, provided that full and clear credit is given to Writing9 with appropriate and specific direction to the original content.

Sentences: Add more complex sentences.
Linking words: Add more linking words.
Common mistake: Your writing should be 150-250 words.
Basic structure: Change the third paragraph.
Vocabulary: Replace the words money with synonyms.
Vocabulary: Only 5 basic words for charts were used.
Vocabulary: Use several vocabularies to present the data in the third paragraph.
What to do next:
Look at other essays: