
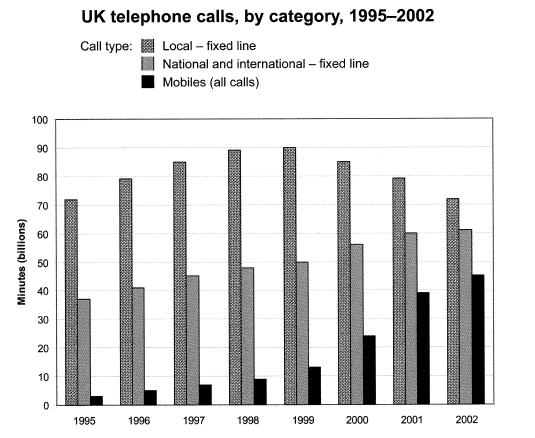
The chart below shows the total number of minutes (in billions) of telephone calls in the UK, divided into three categories, from 1995-2002.
overall
the chart illustrates the total number of minutes (in billions) of telephone calls in the UK, divided into three categories in eight timeline
first, let us talk about Linking Words
local
- fixed Correct article usage
the local
line
. the highest is 1999 (more than ninety billion) and the lowest is 2002 and 1995 with more than 70 billion. Fix the agreement mistake
lines
Linking Words
next
Add a comma
,next
we
Correct pronoun usage
apply
let
talk about the national and international-fixed Add a missing verb
let's
line
. the top is 2002 and the lower rank is 1995. in Fix the agreement mistake
lines
Correct article usage
the other
other hand
the mobiles the topmost is 2002 and the bottom in the leaderboard is 1995.Change the wording
another hand
other hands