
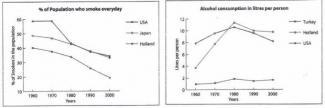
The two graphs below show the
percentage
of Use synonyms
smokers
and the Use synonyms
consumption
of Use synonyms
alcohol
in litres in selected Use synonyms
countries
, for the period 1960-2000. Summarize the information by choosing and reporting the key features, and make any relevant comparisons. The two graphs represent comparisons Use synonyms
the
Change preposition
of the
percentage
of Use synonyms
smokers
in the population every day in Use synonyms
Use synonyms
USA
, Correct article usage
the USA
Japan
, Use synonyms
Use synonyms
Holland
and Correct word choice
and Holland
alcohol
Use synonyms
consumption
in Use synonyms
liters
per Change the spelling
litres
person
Use synonyms
among
Change preposition
in
Turkey
, Use synonyms
Holland
and Use synonyms
Use synonyms
USA
from 1960 to 2000.As can be seen from the first graph, 3 Correct article usage
the USA
countries
of the survey indicated a downward trend in Use synonyms
Use synonyms
percentage
of Add an article
the percentage
smokers
from 1960 to 2000. Use synonyms
Holland
revealed the highest Use synonyms
level
Use synonyms
while
Linking Words
Use synonyms
USA
stood the lowest Correct article usage
the USA
percentage
of Use synonyms
smokers
. In 1960, Use synonyms
Holland
represented 59% of Use synonyms
smokers
Use synonyms
while
Linking Words
Use synonyms
USA
represented 40% and in 2000 Correct article usage
the USA
Holland
showed 32% of Use synonyms
smokers
Use synonyms
while
Linking Words
Use synonyms
USA
indicated 19%. From 1960 to 1970, the Correct article usage
the USA
percentage
of Use synonyms
Holland
Use synonyms
smokers
remained unchanged at 59% during which Use synonyms
Japan
and Use synonyms
USA
dropped very slightly from 49% to 48% and from 40% to 39% respectively.Use synonyms
Holland
represented a dramatic change during Use synonyms
1970s
when its smoker Change the article
the 1970s
percentage
slumped sharply from 59% to 44% Use synonyms
in
between 1970 and 1980. From 1980 to 2000, Change preposition
apply
Holland
and Use synonyms
Japan
seemed Use synonyms
decline
slowly at the same Fix the infinitive
to decline
level
. The gaps Use synonyms
of
Change preposition
in
Use synonyms
percentage
between Fix the agreement mistake
percentages
Japan
and Use synonyms
Use synonyms
USA
Correct article usage
the USA
seemed
stay unchanged Add the particle
toseemed
about
10-12% from 1960 to 2000. It can be clear from the Change preposition
by about
second
graph that 3 Linking Words
countries
rose up to the peak of Use synonyms
alcohol
Use synonyms
consumption
in 1980. Use synonyms
Holland
represented the highest Use synonyms
level
of 11. 3 Use synonyms
lirters
/Correct your spelling
litres
litters
person
Use synonyms
while
Linking Words
USA
and Use synonyms
Turkey
represented the Use synonyms
second
and the Linking Words
third
at 10. 1 and 1. 9 Linking Words
lirters
/Correct your spelling
litres
litters
person
respectively in 1980.Use synonyms
Holland
revealed a dominant increase Use synonyms
of
Change preposition
in
alcohol
Use synonyms
consumption
Use synonyms
while
others showed a gradual one from 1960 to 1980. During Linking Words
this
time, Linking Words
Holland
shot up from 3. 9 litres/Use synonyms
person
in 1960 to the peak of 11. 3% in 1980. If Use synonyms
Use synonyms
USA
showed the highest Correct article usage
the USA
level
of Use synonyms
alcohol
Use synonyms
consumption
in 1960 , Use synonyms
Holland
prevailed above 3 Use synonyms
countries
from 1980 Use synonyms
at
to 2000. Change preposition
apply
Turkey
reveals the lowest Use synonyms
alcohol
Use synonyms
consumption
when it represented the significant gaps among the others. Especially the graph showed the Use synonyms
gaps
of 9. 4 litres/Fix the agreement mistake
gap
person
between Use synonyms
Turkey
and Use synonyms
Holland
Use synonyms
in
the pinnacle of 1980.Change preposition
at