
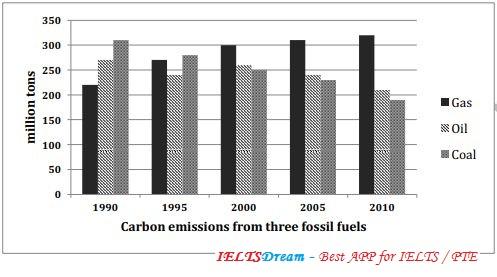
Given is a graph reviewing collected data germane to three dissimilar emission sources of greenhouse
gas
in the UK through the span of two decades from 1990 to 2010.
As per the graph, what is interesting to note is that Use synonyms
emissions
from Use synonyms
gas
witnessed Use synonyms
gradual
upward trend Correct article usage
a gradual
whereas
, coal illustrated a downward trend. Oil saw fluctuation over the period.
As for Linking Words
gas
, over the whole period, Use synonyms
gas
showed a gradual escalation and the figure Use synonyms
of
the Change preposition
for
emissions
from Use synonyms
gas
stood Use synonyms
210
thousand Change preposition
at 210
tons
in 1990 and gained its peak at 310 bank Use synonyms
tons
in 2010.
Turning to the details of coal, the Use synonyms
emissions
from coal tumbled markedly from roundly 310 lot Use synonyms
tons
to 190 sum Use synonyms
tons
over the two decades.
When it comes to the Use synonyms
emissions
from oil, the figure experienced a fluctuation still 2000 Use synonyms
however
, there was a slow decline in carbon Linking Words
emissions
from 2000 to 2010 with 250 and Use synonyms
200 ton
Add a hyphen
200-ton
tons
Use synonyms
oil
Change preposition
of oil
emissions
, respectively.Use synonyms