
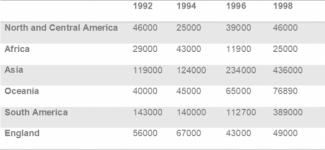
The table illustrates the amounts of
cacao
beans that were produced in six global areas in the Use synonyms
year
1992, 1994 and 1998.
Fix the agreement mistake
years
Overall
, Linking Words
cacao
Use synonyms
production
increased in some areas and decreased in others. South Use synonyms
America
and Use synonyms
Asia
were the leading producers over the given period. Use synonyms
Furthermore
, Linking Words
The
significant increase in Correct article usage
A
cacao
Use synonyms
bean
Use synonyms
production
was seen in Use synonyms
Asia
.
Between 1992 and 1998, Use synonyms
the
Correct article usage
apply
cacao
Use synonyms
bean
Use synonyms
production
in South Use synonyms
America
rose from 1,43,000 Use synonyms
tons
to 3,89,000 Use synonyms
tons
and rising trends were Use synonyms
also
observed in Linking Words
Asia
and Oceania, with increasing from 1,19,000 to 4,36,000 and from 40,000 to 76,840 Use synonyms
tons
respectively. Use synonyms
Asia
Use synonyms
also
had Linking Words
the
higher output rate Correct article usage
a
in
each year peaking in 1998.
The trends for North and Central Change preposition
apply
America
, Africa and England fluctuated from 1992 to 1998. Africa and England cut their Use synonyms
cacao
Use synonyms
bean
Use synonyms
production
by 4,000 and 7,000 Use synonyms
tons
respectively, and Africa had the notably lowest figure in 1998. Use synonyms
On the other hand
, even though, small increases in Linking Words
production
of the coffee Use synonyms
bean
were seen in North and Central Use synonyms
America
, the value remained the same in 1992 and 1998.Use synonyms